k8s部署grafana beyla
OS:
Static hostname: test
Icon name: computer-vm
Chassis: vm
Machine ID: 22349ac6f9ba406293d0541bcba7c05d
Boot ID: 83bb7e5dbf27453c94ff9f1fe88d5f02
Virtualization: vmware
Operating System: Ubuntu 22.04.4 LTS
Kernel: Linux 5.15.0-105-generic
Architecture: x86-64
Hardware Vendor: VMware, Inc.
Hardware Model: VMware Virtual Platform
kubespray version:
2.25.0
kubernetes version:
1.29.5
部署测试用nginx
cat > nginx.yaml <<EOF
kind: Deployment
apiVersion: apps/v1
metadata:name: docs
spec:replicas: 2selector:matchLabels:app: docstemplate:metadata:labels:app: docsspec:containers:- name: docs-serverimage: httpd:latestports:- containerPort: 80protocol: TCPname: http
---
apiVersion: v1
kind: Service
metadata:name: docs
spec:selector:app: docsports:- protocol: TCPport: 80
---
kind: Deployment
apiVersion: apps/v1
metadata:name: website
spec:replicas: 2selector:matchLabels:app: websitetemplate:metadata:labels:app: websitespec:containers:- name: website-serverimage: dockerhub.timeweb.cloud/httpd:latestports:- containerPort: 80protocol: TCPname: http
---
apiVersion: v1
kind: Service
metadata:name: website
spec:selector:app: websiteports:- protocol: TCPport: 80
EOF
# 创建
kubectl apply -f nginx.yaml
# 转发端口
kubectl port-forward services/website 8080:80
kubectl port-forward services/docs 8081:80
部署grafana beyla
# 创建命名空间
kubectl create namespace beyla
# 创建serviceaccount
cat > beyla-serviceaccount.yaml <<EOF
apiVersion: v1
kind: ServiceAccount
metadata:namespace: beylaname: beyla
---
apiVersion: rbac.authorization.k8s.io/v1
kind: ClusterRole
metadata:name: beyla
rules:- apiGroups: ["apps"]resources: ["replicasets"]verbs: ["list", "watch"]- apiGroups: [""]resources: ["pods"]verbs: ["list", "watch"]
---
apiVersion: rbac.authorization.k8s.io/v1
kind: ClusterRoleBinding
metadata:name: beyla
subjects:- kind: ServiceAccountname: beylanamespace: beyla
roleRef:apiGroup: rbac.authorization.k8s.iokind: ClusterRolename: beyla
EOFkubectl apply -f beyla-serviceaccount.yamlcat > beyla.yaml <<EOF
apiVersion: v1
kind: ConfigMap
metadata:namespace: beylaname: beyla-config
data:beyla-config.yml: |# this is required to enable kubernetes discovery and metadataattributes:kubernetes:enable: true# this will provide automatic routes report while minimizing cardinalityroutes:unmatched: heuristic# let's instrument only the docs serverdiscovery:services:- k8s_deployment_name: "^docs$"# uncomment the following line to also instrument the website server# - k8s_deployment_name: "^website$"
---
apiVersion: apps/v1
kind: DaemonSet
metadata:namespace: beylaname: beyla
spec:selector:matchLabels:instrumentation: beylatemplate:metadata:labels:instrumentation: beylaspec:serviceAccountName: beylahostPID: true # mandatory!containers:- name: beylaimage: dockerhub.timeweb.cloud/grafana/beyla:1.2imagePullPolicy: IfNotPresentsecurityContext:privileged: true # mandatory!readOnlyRootFilesystem: truevolumeMounts:- mountPath: /configname: beyla-config- mountPath: /var/run/beylaname: var-run-beylaenv:- name: BEYLA_CONFIG_PATHvalue: "/config/beyla-config.yml"- name: OTEL_EXPORTER_OTLP_TRACES_ENDPOINTvalue: "http://10.1.1.71:4318/v1/traces"- name: OTEL_EXPORTER_OTLP_TRACES_PROTOCOLvalue: "http/protobuf"
#            - name: OTEL_EXPORTER_OTLP_HEADERS
#              valueFrom:
#                secretKeyRef:
#                  name: grafana-credentials
#                  key: otlp-headersvolumes:- name: beyla-configconfigMap:name: beyla-config- name: var-run-beylaemptyDir: {}
EOFkubectl apply -f beyla.yaml
安装grafana
apt-get install -y adduser libfontconfig1 musl
wget https://dl.grafana.com/oss/release/grafana_10.4.2_amd64.deb
dpkg -i grafana_10.4.2_amd64.deb
systemctl start grafana-server
systemctl enable grafana-server
安装prometheus
wget --no-check-certificate https://github.com/prometheus/prometheus/releases/download/v2.45.4/prometheus-2.45.4.linux-amd64.tar.gz
tar -zxf prometheus-2.45.4.linux-amd64.tar.gz
mkdir -p /etc/prometheus
mkdir -p /export/prometheus/data
cp -r prometheus-2.45.4.linux-amd64/* /etc/prometheus/
mv /etc/prometheus/prometheus /usr/local/bin/
mv /etc/prometheus/promtool /usr/local/bin/# 配置抓取promttheus
cat <<EOF >/etc/prometheus/prometheus.yml
global:
alerting:alertmanagers:- static_configs:- targets:# - alertmanager:9093
rule_files:# - "first_rules.yml"# - "second_rules.yml"
scrape_configs:- job_name: "prometheus"static_configs:- targets: ["localhost:9090"]- job_name: "beyla"static_configs:- targets: ["localhost:9101", "localhost:9102", "localhost:9103"]
EOF
# 启动
# 使用--web.enable-remote-write-receiver启用远程写入接口来接收tempo的service graph数据,地址为/api/v1/write
screen -dmS prom prometheus --config.file=/etc/prometheus/prometheus.yml --web.enable-remote-write-receiver --storage.tsdb.path=/export/prometheus/data --web.console.libraries=/etc/prometheus/console_libraries --web.console.templates=/etc/prometheus/consoles --storage.tsdb.retention=7d &
安装tempo
tempo部署
tempo配置
安装
curl -Lo tempo_2.4.1_linux_amd64.deb https://github.com/grafana/tempo/releases/download/v2.4.1/tempo_2.4.1_linux_amd64.deb
echo 2fdd167cbb00d732435123a254469ec4cfde3c525a4ec89d235423a5e9abc4b3 \tempo_2.4.1_linux_amd64.deb | sha256sum -c
dpkg -i tempo_2.4.1_linux_amd64.deb
配置
cat > /etc/tempo/config.yml <<EOF
server:http_listen_port: 3200distributor:receivers:otlp:protocols:http:grpc:compactor:compaction:block_retention: 48hmetrics_generator:registry:external_labels:source: tempocluster: linux-microservicesstorage:path: /tmp/tempo/generator/walremote_write:- url: http://localhost:9090/api/v1/writesend_exemplars: truestorage:
#   trace:
#     backend: s3
#     s3:
#       endpoint: s3.us-east-1.amazonaws.com
#       bucket: grafana-traces-data
#       forcepathstyle: true
#       # set to false if endpoint is https
#       insecure: true
#       access_key: # TODO - Add S3 access key
#       secret_key: # TODO - Add S3 secret keytrace:backend: localwal:path: /tmp/tempo/wallocal:path: /tmp/tempo/blocks
overrides:defaults:metrics_generator:processors: [service-graphs, span-metrics]
EOF
启动
systemctl start tempo.service
systemctl enable tempo.service
systemctl is-active tempo
生成trace数据
访问生成trace信息
curl http://localhost:8080
curl http://localhost:8080/foo
curl http://localhost:8081
curl http://localhost:8081/foo
tail pod日志
kubectl logs -f beyla-spb9s -n beyla
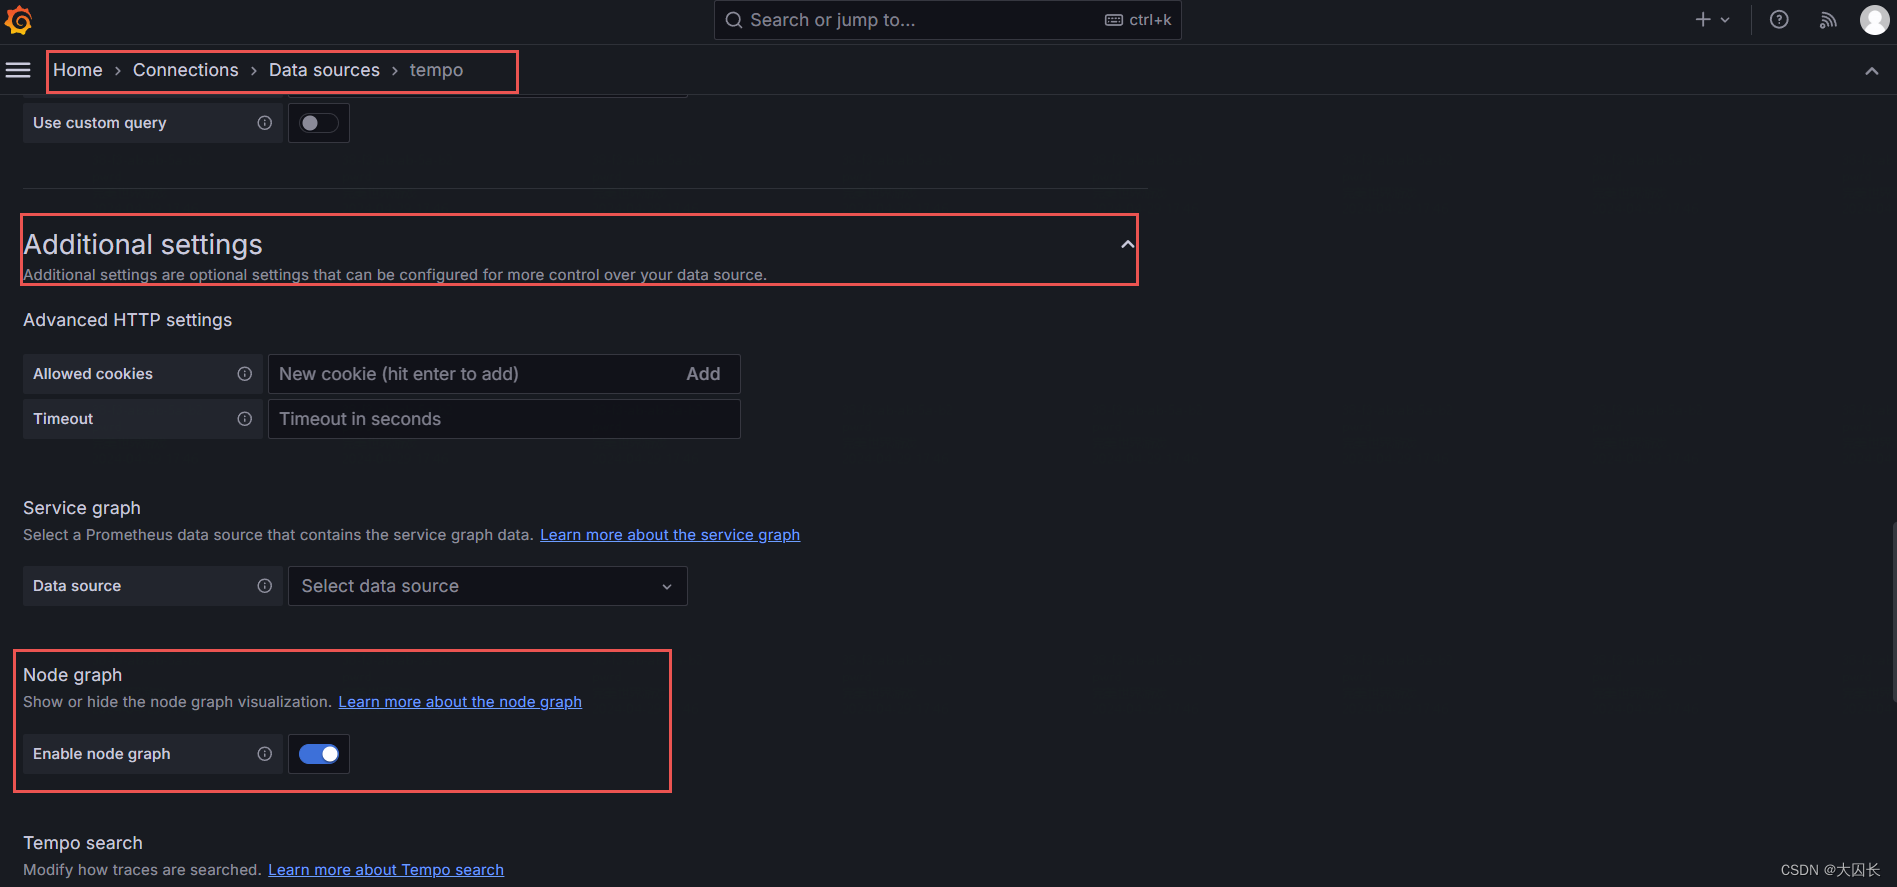
grafana面板配置
添加tempo源并启用node graph

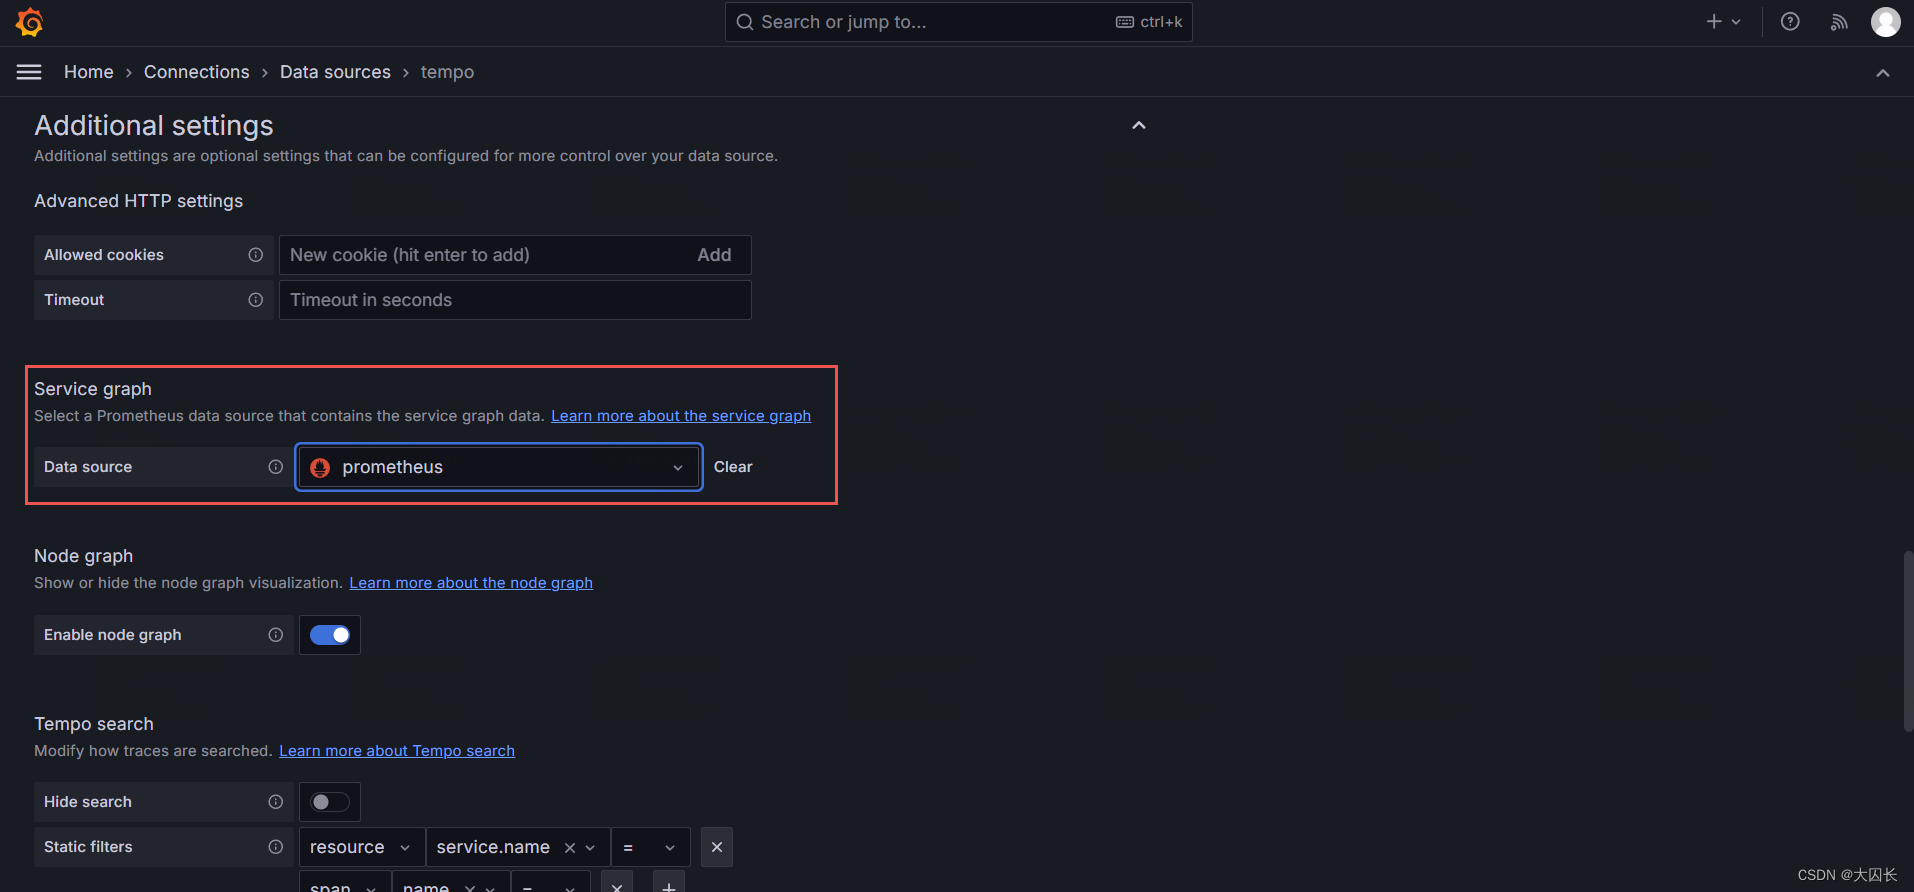
启用service graph
prometheus需要使用–web.enable-remote-write-receiver启用远程写入接口来接收tempo的service graph数据,地址为/api/v1/write
prometheus http API
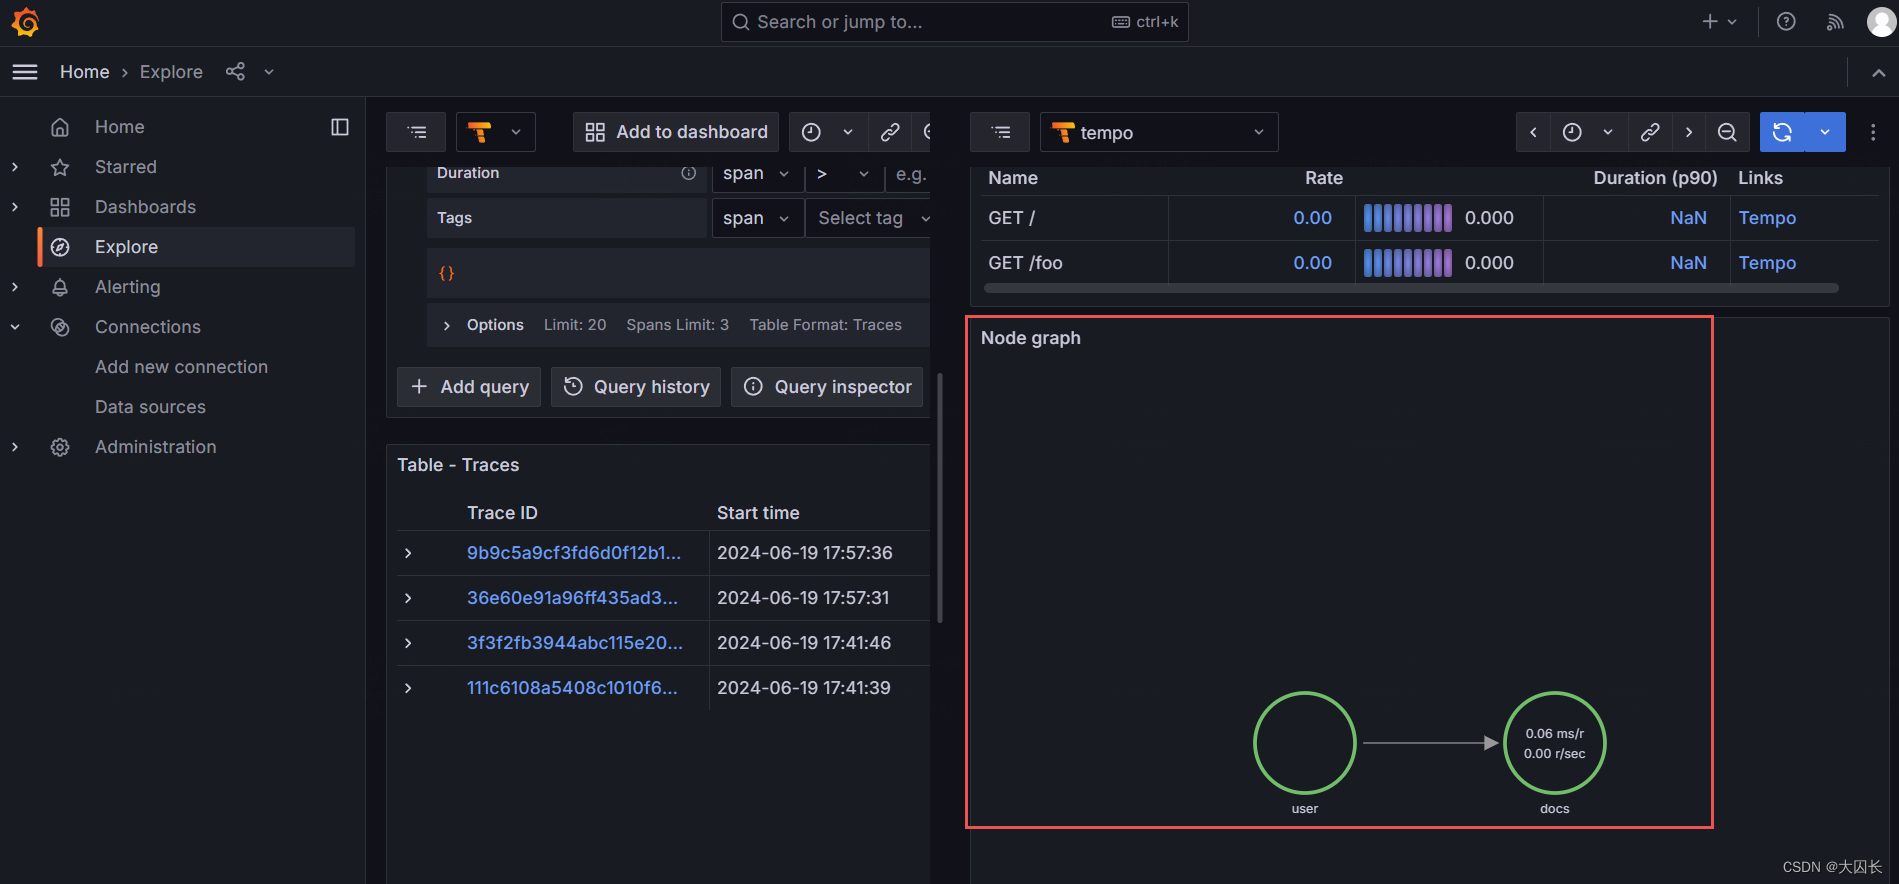
在explorer中搜索service graph
设置hosts
# vim /etc/hosts
127.0.0.1 prometheus


