🧑 博主简介:曾任某智慧城市类企业
算法总监,目前在美国市场的物流公司从事高级算法工程师一职,深耕人工智能领域,精通python数据挖掘、可视化、机器学习等,发表过AI相关的专利并多次在AI类比赛中获奖。CSDN人工智能领域的优质创作者,提供AI相关的技术咨询、项目开发和个性化解决方案等服务,如有需要请站内私信或者联系任意文章底部的的VX名片(ID:xf982831907)
💬 博主粉丝群介绍:① 群内初中生、高中生、本科生、研究生、博士生遍布,可互相学习,交流困惑。② 热榜top10的常客也在群里,也有数不清的万粉大佬,可以交流写作技巧,上榜经验,涨粉秘籍。③ 群内也有职场精英,大厂大佬,可交流技术、面试、找工作的经验。④ 进群免费赠送写作秘籍一份,助你由写作小白晋升为创作大佬。⑤ 进群赠送CSDN评论防封脚本,送真活跃粉丝,助你提升文章热度。有兴趣的加文末联系方式,备注自己的CSDN昵称,拉你进群,互相学习共同进步。

【数据可视化-19】智能手机用户行为可视化分析
- 一、引言
- 二、数据概述和探索
- 2.1 导入python库
- 2.2 加载数据探索
- 三、描述性分析
- 四、用户行为可视化分析
- 4.1 用户行为类别分布
- 4.2 用户行为与设备型号
- 4.3 用户行为与操作系统
- 4.4 用户行为与应用使用时间
- 4.5 用户行为与屏幕活跃时间
- 4.6 用户行为与电池消耗量
- 4.7 用户行为与安装应用数量
- 4.8 用户行为与每日数据消耗量
- 4.9 用户行为与年龄
- 4.10 用户行为与性别
- 五、总结
一、引言
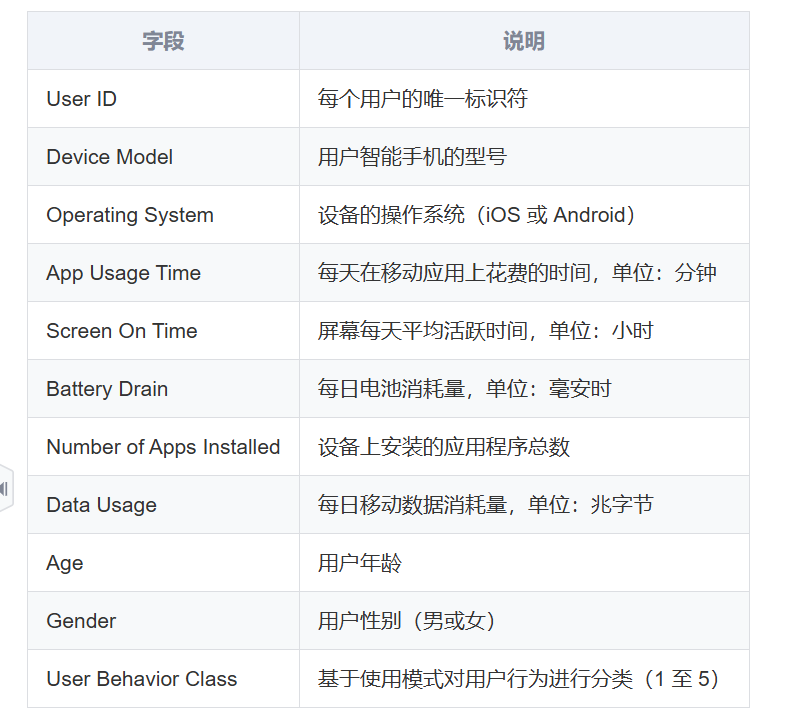
在5G时代,智能手机已经成为我们生活中不可或缺的一部分。随着各类应用的丰富发展,用户的使用行为也呈现出多样化的特点。为了更好地理解用户的使用习惯,本文通过模拟生成的700位用户智能手机使用数据,进行深入分析,探索不同用户群体的使用行为特征。

二、数据概述和探索
数据集包含以下字段:
2.1 导入python库
import pandas as pd
import numpy as np
import seaborn as sns
import matplotlib.pyplot as plt%matplotlib inlineimport warnings
warnings.filterwarnings('ignore')# 设置中文字体
plt.rcParams['font.sans-serif']=['SimHei'] #用来正常显示中文标签
plt.rcParams['axes.unicode_minus']=False #用来正常显示负号
2.2 加载数据探索
data = pd.read_csv("user_behavior_dataset.csv")print('查看数据信息:')
data.info()
print(f'查看重复值:{data.duplicated().sum()}')
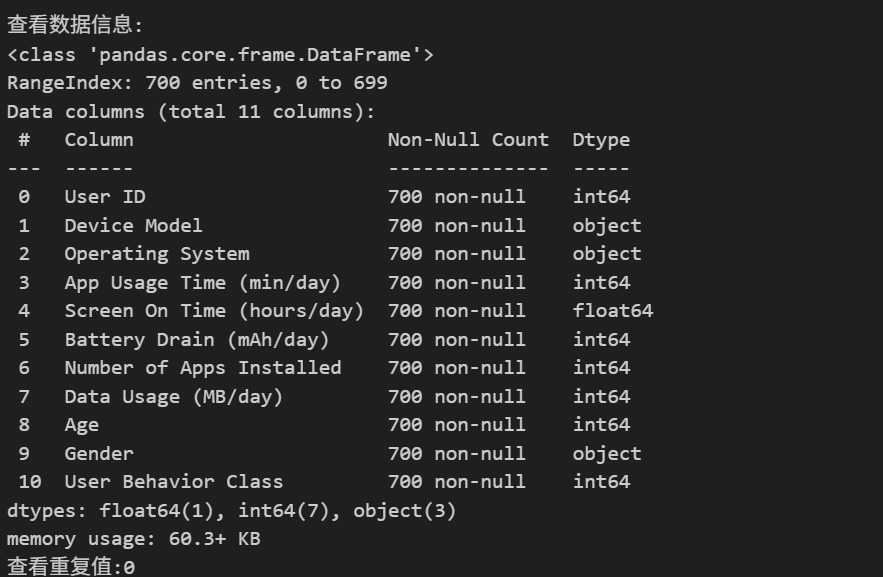
数据集无缺失值和重复值,整体质量良好,适合进行深入分析。
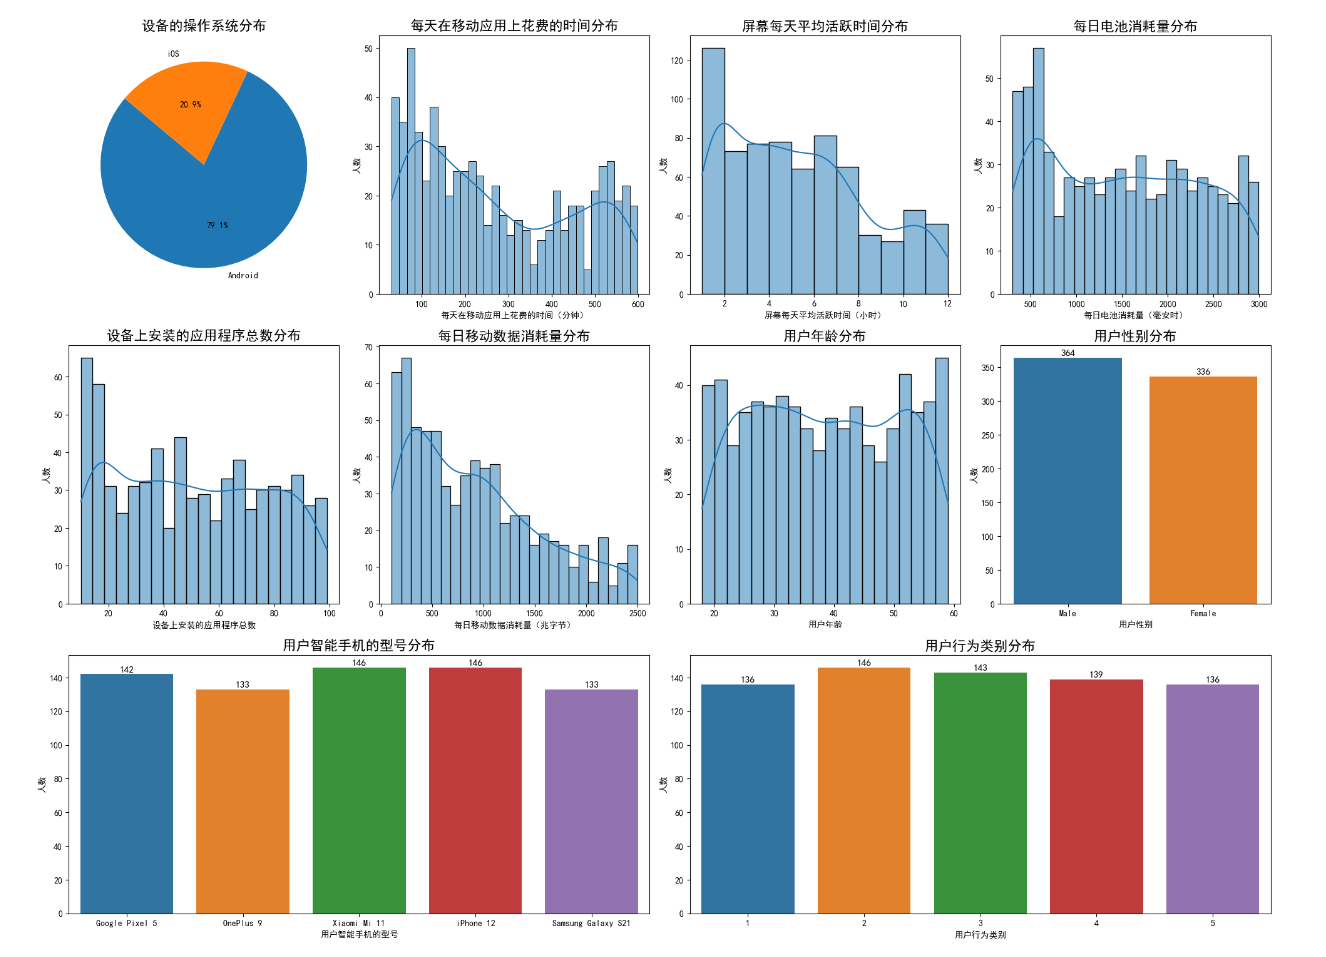
三、描述性分析
plt.figure(figsize=(20,15))
plt.subplot(3, 4, 1)
Operating_System_counts = data['Operating System'].value_counts()
plt.pie(Operating_System_counts, labels=Operating_System_counts.index, autopct='%1.1f%%', startangle=140)
plt.title('设备的操作系统分布', fontsize=16)plt.subplot(3, 4, 2)
sns.histplot(data['App Usage Time (min/day)'], kde=True,bins=32)
plt.title('每天在移动应用上花费的时间分布', fontsize=16)
plt.xlabel('每天在移动应用上花费的时间(分钟)')
plt.ylabel('人数')plt.subplot(3, 4, 3)
sns.histplot(data['Screen On Time (hours/day)'], kde=True,bins=11)
plt.title('屏幕每天平均活跃时间分布', fontsize=16)
plt.xlabel('屏幕每天平均活跃时间(小时)')
plt.ylabel('人数')plt.subplot(3, 4, 4)
sns.histplot(data['Battery Drain (mAh/day)'], kde=True,bins=24)
plt.title('每日电池消耗量分布', fontsize=16)
plt.xlabel('每日电池消耗量(毫安时)')
plt.ylabel('人数')plt.subplot(3, 4, 5)
sns.histplot(data['Number of Apps Installed'], kde=True,bins=21)
plt.title('设备上安装的应用程序总数分布', fontsize=16)
plt.xlabel('设备上安装的应用程序总数')
plt.ylabel('人数')plt.subplot(3, 4, 6)
sns.histplot(data['Data Usage (MB/day)'], kde=True,bins=25)
plt.title('每日移动数据消耗量分布', fontsize=16)
plt.xlabel('每日移动数据消耗量(兆字节)')
plt.ylabel('人数')plt.subplot(3, 4, 7)
sns.histplot(data['Age'], kde=True,bins=20)
plt.title('用户年龄分布', fontsize=16)
plt.xlabel('用户年龄')
plt.ylabel('人数')ax8 = plt.subplot(3, 4, 8)
sns.countplot(x='Gender', data=data)
plt.title('用户性别分布', fontsize=16)
plt.xlabel('用户性别')
plt.ylabel('人数')
for p in ax8.patches:ax8.annotate(f'{p.get_height()}', (p.get_x() + p.get_width() / 2., p.get_height()),ha='center', va='center', fontsize=11, color='black', xytext=(0, 5),textcoords='offset points')ax9 = plt.subplot(3, 4, (9,10))
sns.countplot(x='Device Model', data=data)
plt.title('用户智能手机的型号分布', fontsize=16)
plt.xlabel('用户智能手机的型号')
plt.ylabel('人数')
for p in ax9.patches:ax9.annotate(f'{p.get_height()}', (p.get_x() + p.get_width() / 2., p.get_height()),ha='center', va='center', fontsize=11, color='black', xytext=(0, 5),textcoords='offset points')ax11 = plt.subplot(3, 4, (11,12))
sns.countplot(x='User Behavior Class', data=data)
plt.title('用户行为类别分布', fontsize=16)
plt.xlabel('用户行为类别')
plt.ylabel('人数')
for p in ax11.patches:ax11.annotate(f'{p.get_height()}', (p.get_x() + p.get_width() / 2., p.get_height()),ha='center', va='center', fontsize=11, color='black', xytext=(0, 5),textcoords='offset points')plt.tight_layout()
plt.show()
四、用户行为可视化分析
4.1 用户行为类别分布
# 用户行为类别分布
plt.figure(figsize=(10, 6))
sns.countplot(x='User Behavior Class', data=data)
plt.title('用户行为类别分布', fontsize=16)
plt.xlabel('用户行为类别', fontsize=12)
plt.ylabel('人数', fontsize=12)
plt.show()
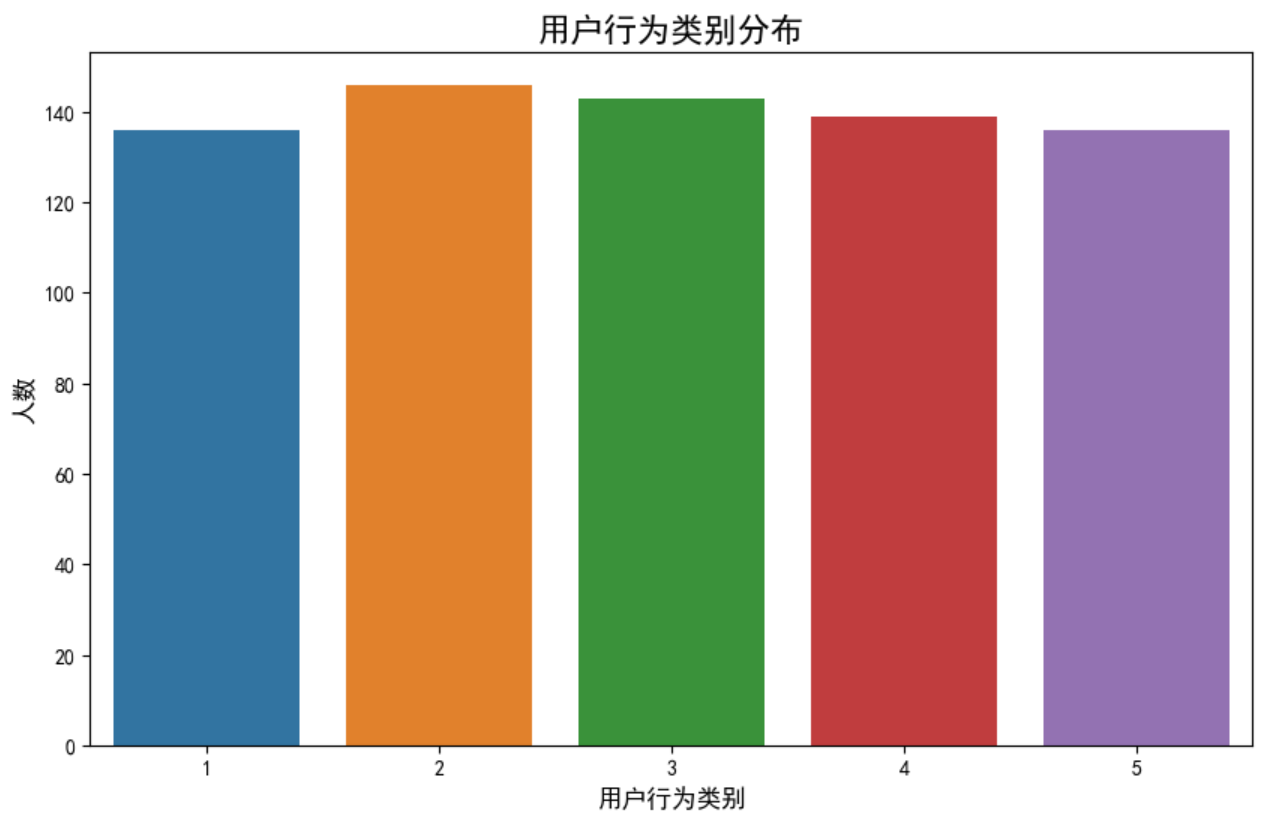
用户行为根据使用模式被分类为1到5,分布相对均匀。2类用户最多,1类和5类最少,但与最多类仅相差10人。
4.2 用户行为与设备型号
device_model_sales = data.groupby(['User Behavior Class', 'Device Model']).size().unstack(fill_value=0)fig, ax = plt.subplots(figsize=(16, 8))
device_model_sales.plot(kind='bar', stacked=True, ax=ax)
for i, (behavior_idx, model_row) in enumerate(device_model_sales.iterrows()):cum_height = 0for model_idx, value in model_row.items():percentage = value / model_row.sum() * 100if value > 0:ax.text(i, cum_height + value/2, f'{model_idx}: {percentage:.1f}%', ha='center', va='center', color='black', fontsize=12, fontweight='bold')cum_height += valueax.legend().set_visible(False)
ax.set_title('用户行为类别与设备型号分布', fontsize=16)
ax.set_xlabel('用户行为类别', fontsize=12)
ax.set_ylabel('用户数量', fontsize=12)
ax.set_xticklabels(device_model_sales.index, rotation=0)
plt.tight_layout()
plt.show()
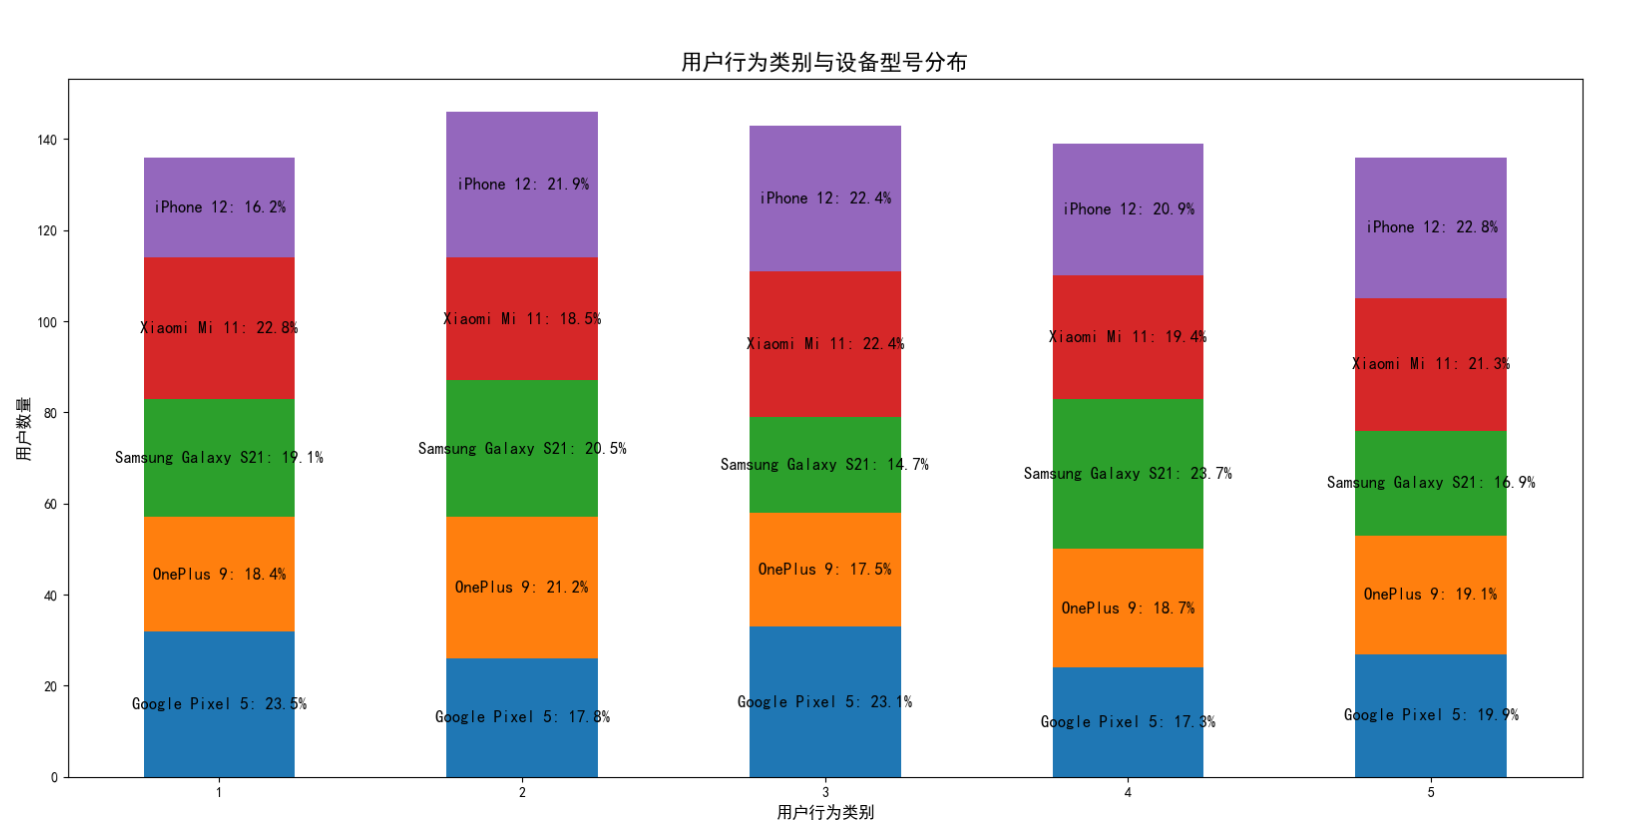
不同用户行为类别的设备型号分布显示,1类用户使用谷歌和小米的比较多,2类用户使用三星、苹果和一加的比较多,3类用户使用苹果、小米、谷歌的比较多,4类用户使用三星的占比最大,5类用户使用苹果占比最大。
4.3 用户行为与操作系统
os_sales = data.groupby(['User Behavior Class', 'Operating System']).size().unstack(fill_value=0)fig, ax = plt.subplots(figsize=(16, 8))
os_sales.plot(kind='bar', stacked=True, ax=ax)
for i, (behavior_idx, model_row) in enumerate(os_sales.iterrows()):cum_height = 0for model_idx, value in model_row.items():percentage = value / model_row.sum() * 100if value > 0:ax.text(i, cum_height + value/2, f'{model_idx}: {percentage:.1f}%', ha='center', va='center', color='black', fontsize=12, fontweight='bold')cum_height += valueax.legend().set_visible(False)
ax.set_title('用户行为类别与操作系统分布', fontsize=16)
ax.set_xlabel('用户行为类别', fontsize=12)
ax.set_ylabel('用户数量', fontsize=12)
ax.set_xticklabels(os_sales.index, rotation=0)
plt.tight_layout()
plt.show()
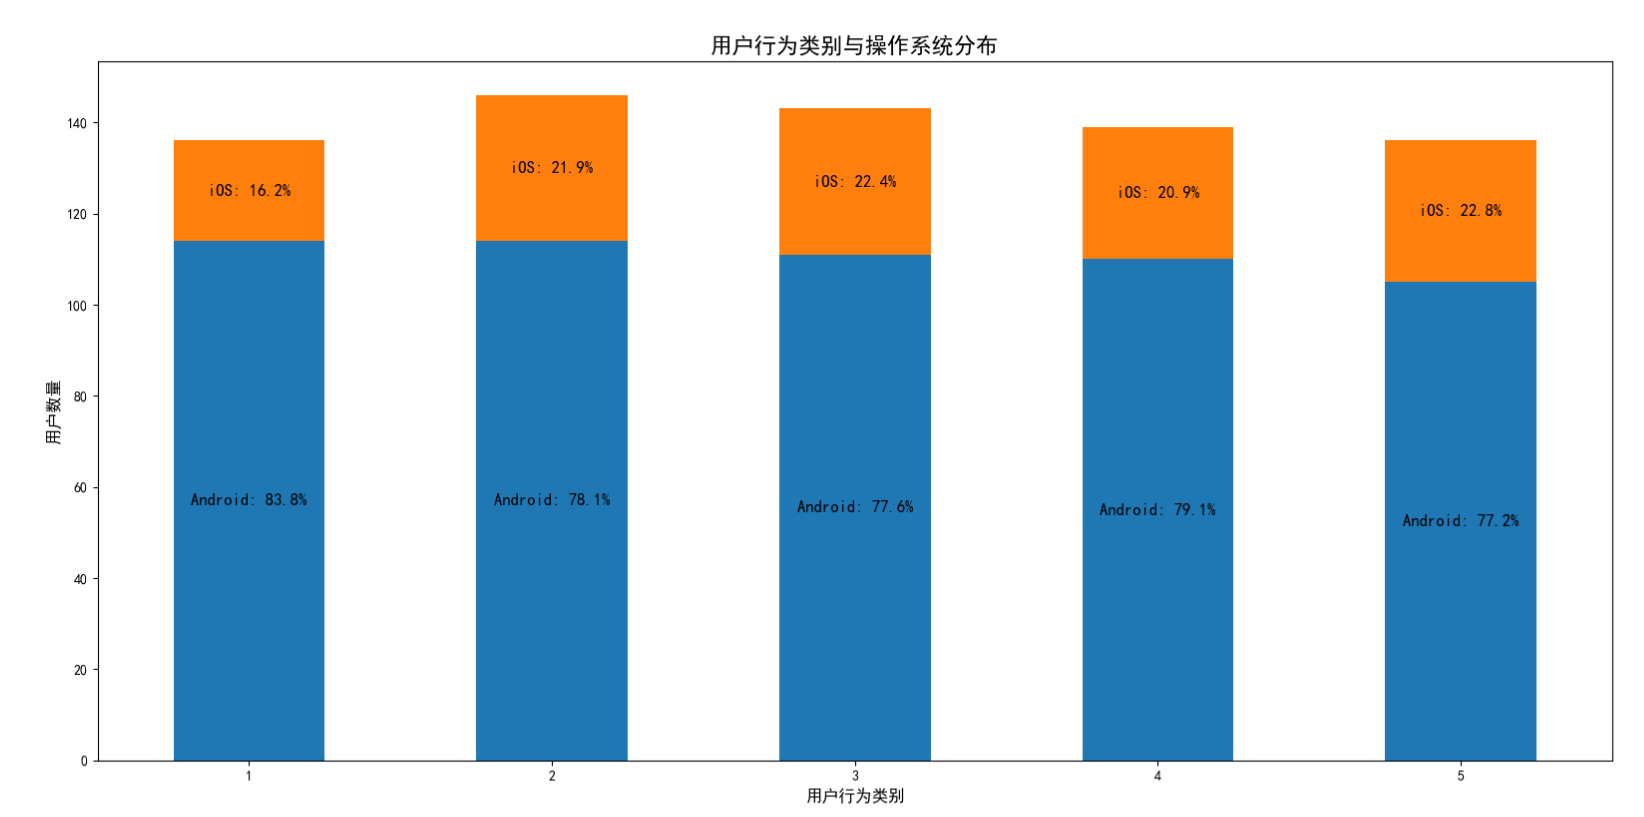
由于数据中,5类品牌手机,有4类是安卓系统的,导致每一类都是安卓使用的最多。但当使用苹果手机的用户占比比较大的时候,对应的iOS系统占比也比较大。
4.4 用户行为与应用使用时间
plt.figure(figsize=(16, 8))
sns.boxplot(x=data['User Behavior Class'], y=data['App Usage Time (min/day)'])
plt.title('用户行为类别与每天在移动应用上花费的时间分布', fontsize=16)
plt.xlabel('用户行为类别', fontsize=12)
plt.ylabel('每天在移动应用上花费的时间(分钟)', fontsize=12)
plt.show()
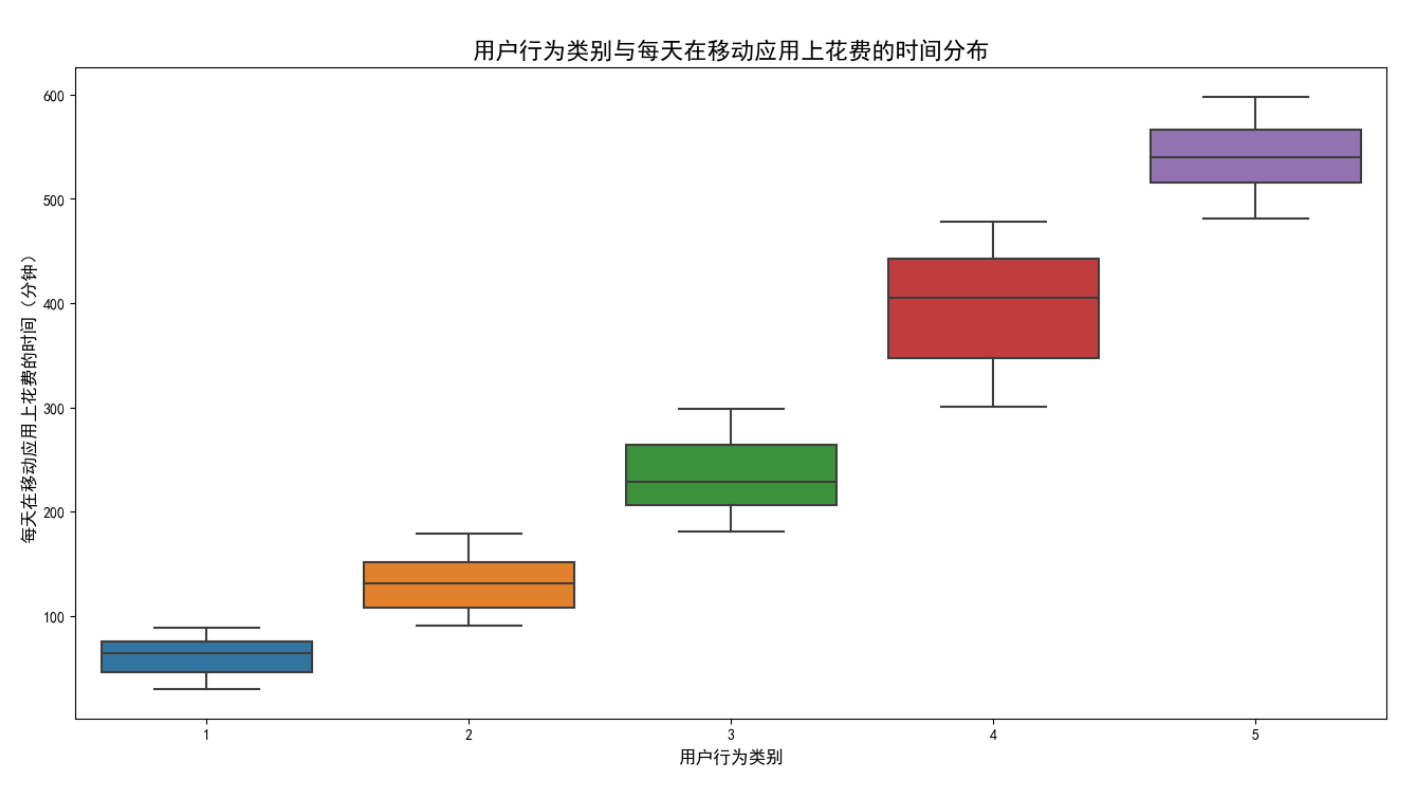
1类用户到5类用户,每天在移动应用上花费的时间显著增多,表明这是划分用户类别的主要因素之一。
4.5 用户行为与屏幕活跃时间
plt.figure(figsize=(16, 8))
sns.boxplot(x=data['User Behavior Class'], y=data['Screen On Time (hours/day)'])
plt.title('用户行为类别与屏幕每天平均活跃时间分布', fontsize=16)
plt.xlabel('用户行为类别', fontsize=12)
plt.ylabel('屏幕每天平均活跃时间(小时)', fontsize=12)
plt.show()
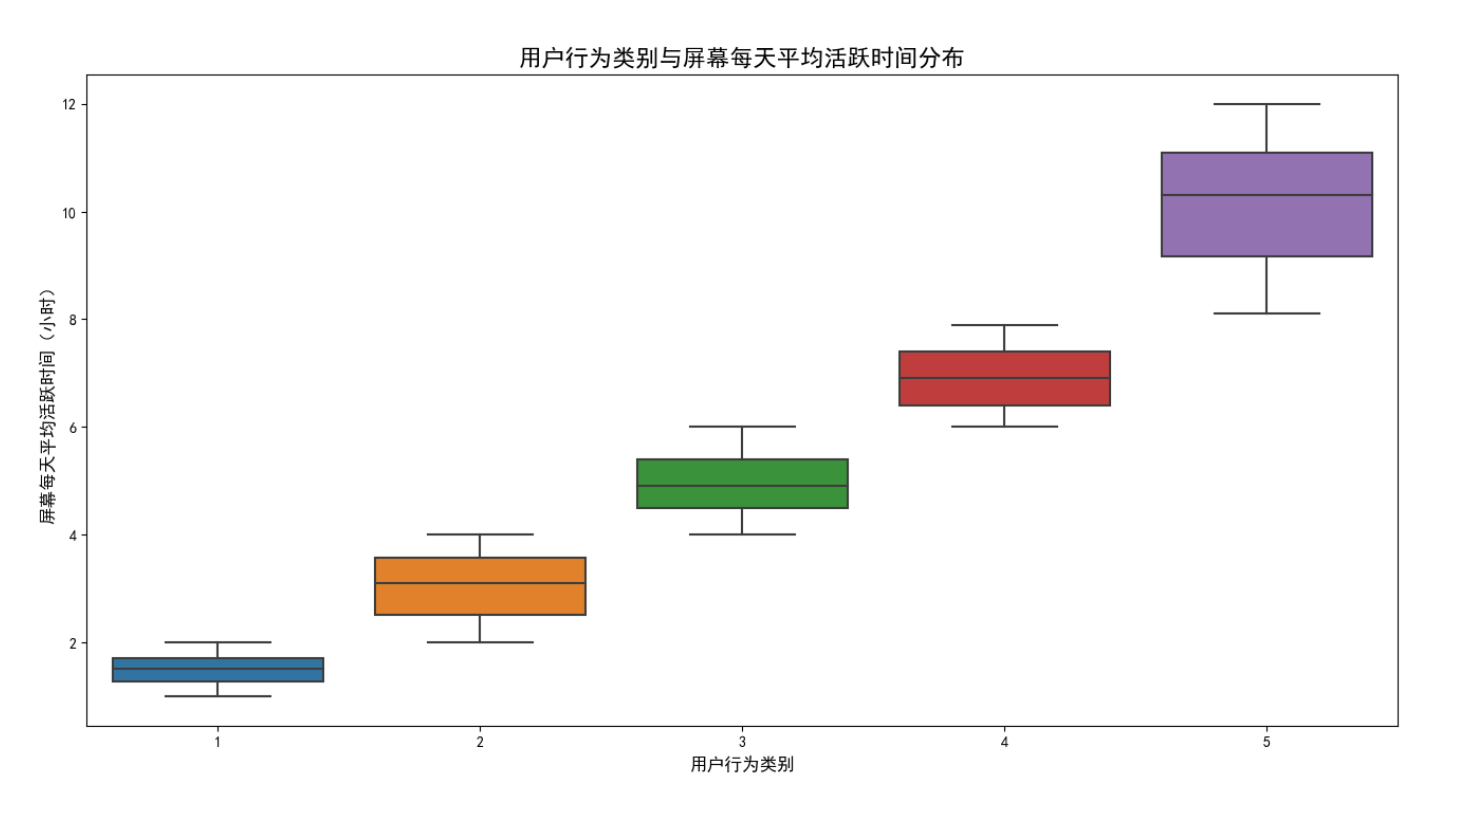
1类用户到5类用户,屏幕每天平均活跃时间也显著增多,表明这是划分用户类别的主要因素之一。
4.6 用户行为与电池消耗量
plt.figure(figsize=(16, 8))
sns.boxplot(x=data['User Behavior Class'], y=data['Battery Drain (mAh/day)'])
plt.title('用户行为类别与每日电池消耗量分布', fontsize=16)
plt.xlabel('用户行为类别', fontsize=12)
plt.ylabel('每日电池消耗量(毫安时)', fontsize=12)
plt.show()
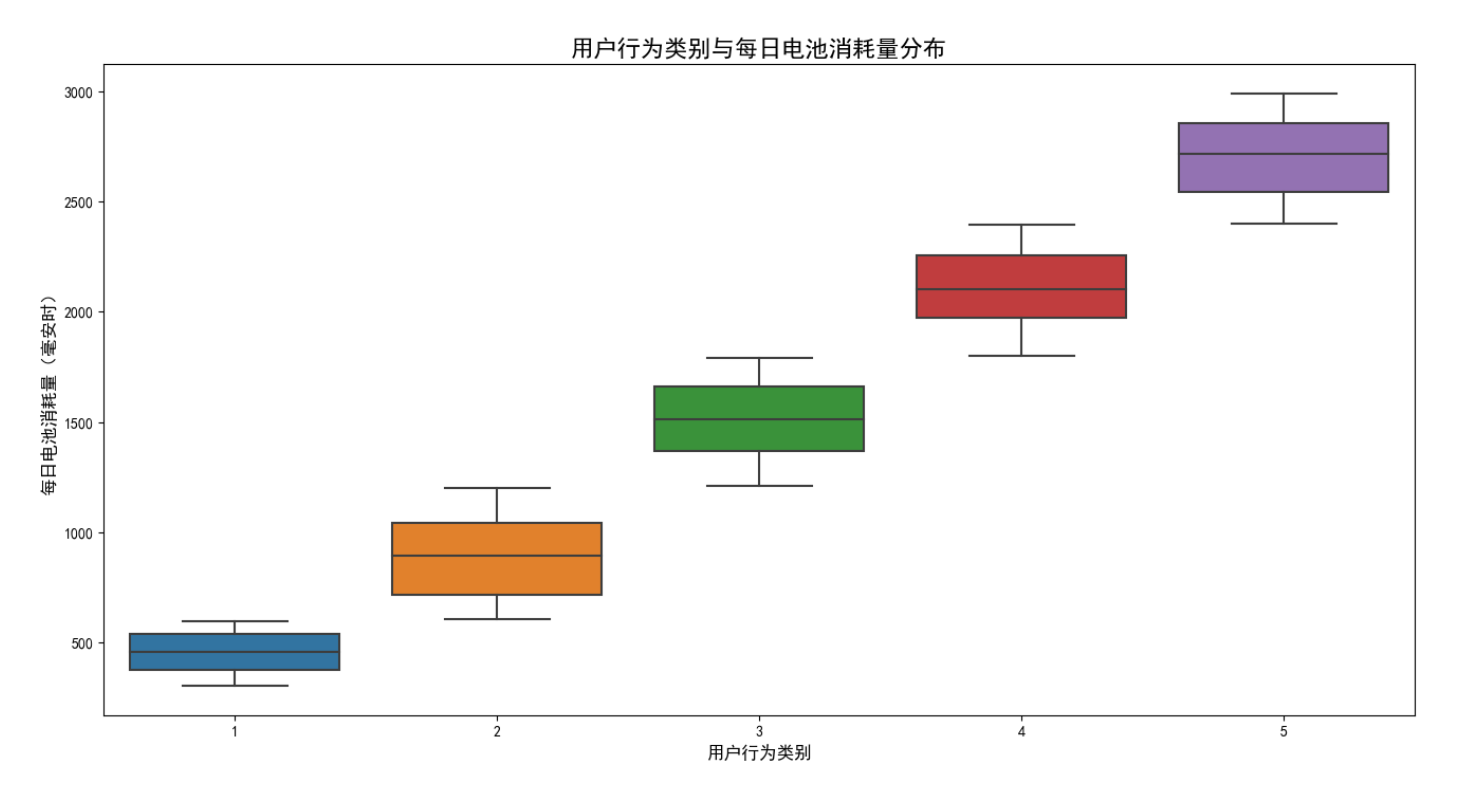
1类用户到5类用户,每日电池消耗量显著增多,表明这是划分用户类别的主要因素之一。
4.7 用户行为与安装应用数量
plt.figure(figsize=(16, 8))
sns.boxplot(x=data['User Behavior Class'], y=data['Number of Apps Installed'])
plt.title('用户行为类别与设备上安装的应用程序总数分布', fontsize=16)
plt.xlabel('用户行为类别', fontsize=12)
plt.ylabel('设备上安装的应用程序总数', fontsize=12)
plt.show()
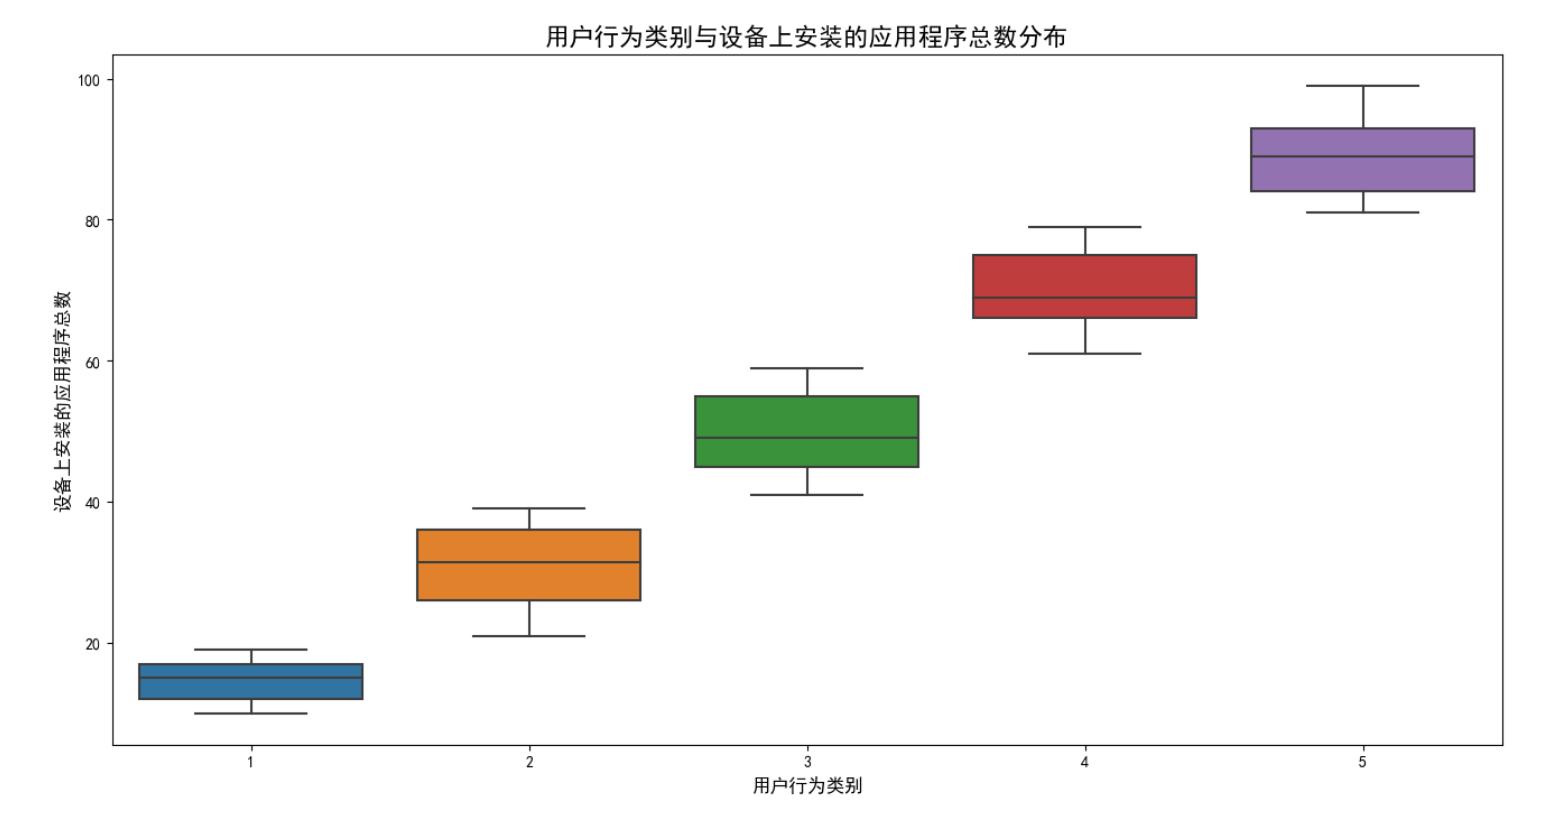
1类用户到5类用户,设备上安装的应用程序总数显著增多,表明这是划分用户类别的主要因素之一。
4.8 用户行为与每日数据消耗量
plt.figure(figsize=(16, 8))
sns.boxplot(x=data['User Behavior Class'], y=data['Data Usage (MB/day)'])
plt.title('用户行为类别与每日移动数据消耗量分布', fontsize=16)
plt.xlabel('用户行为类别', fontsize=12)
plt.ylabel('每日移动数据消耗量(兆字节)', fontsize=12)
plt.show()
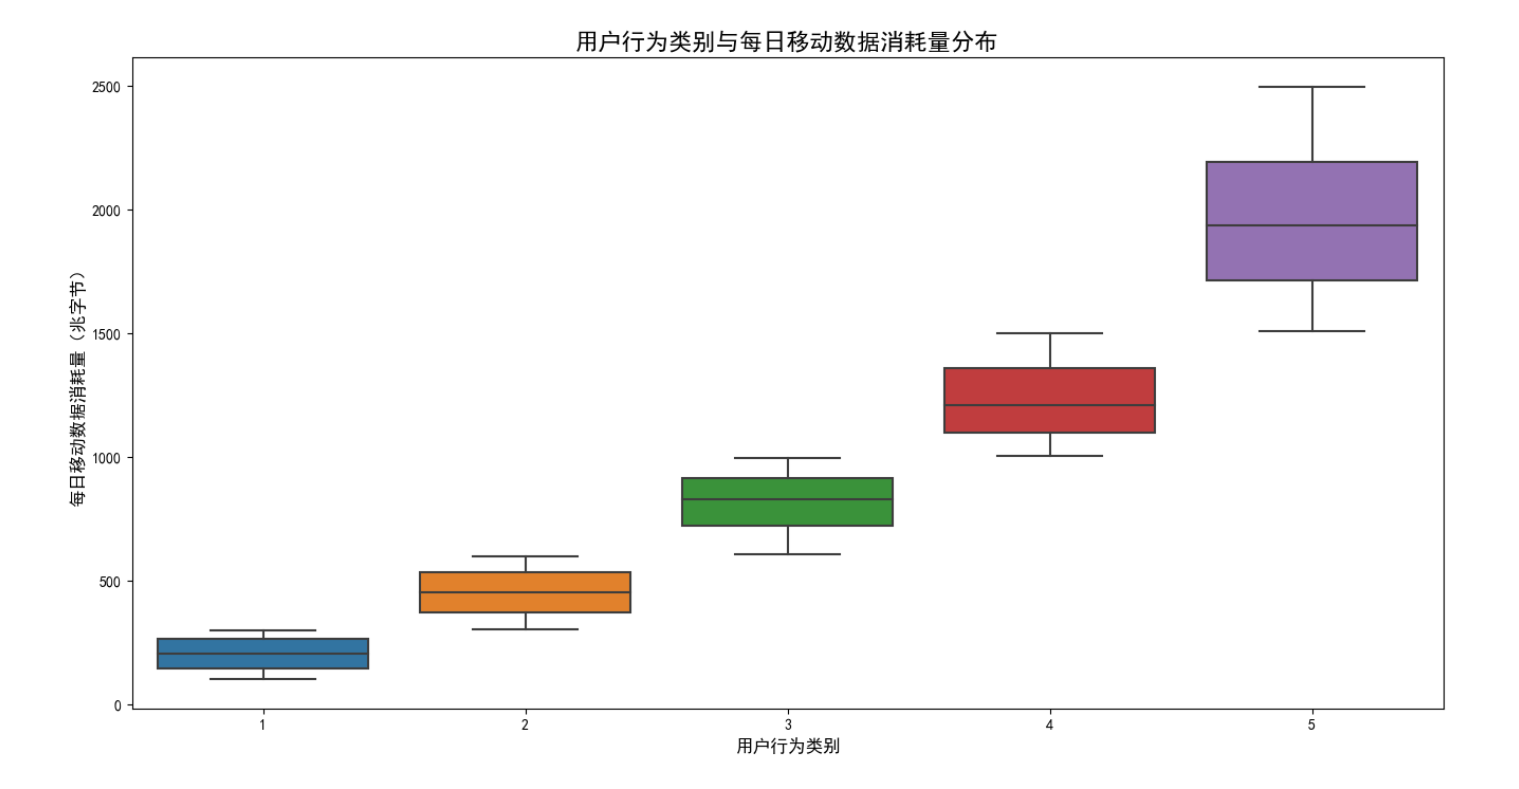
1类用户到5类用户,每日移动数据消耗量显著增多,表明这是划分用户类别的主要因素之一。
4.9 用户行为与年龄
plt.figure(figsize=(16, 8))
sns.boxplot(x=data['User Behavior Class'], y=data['Age'])
plt.title('用户行为类别与用户年龄分布', fontsize=16)
plt.xlabel('用户行为类别', fontsize=12)
plt.ylabel('用户年龄', fontsize=12)
plt.show()
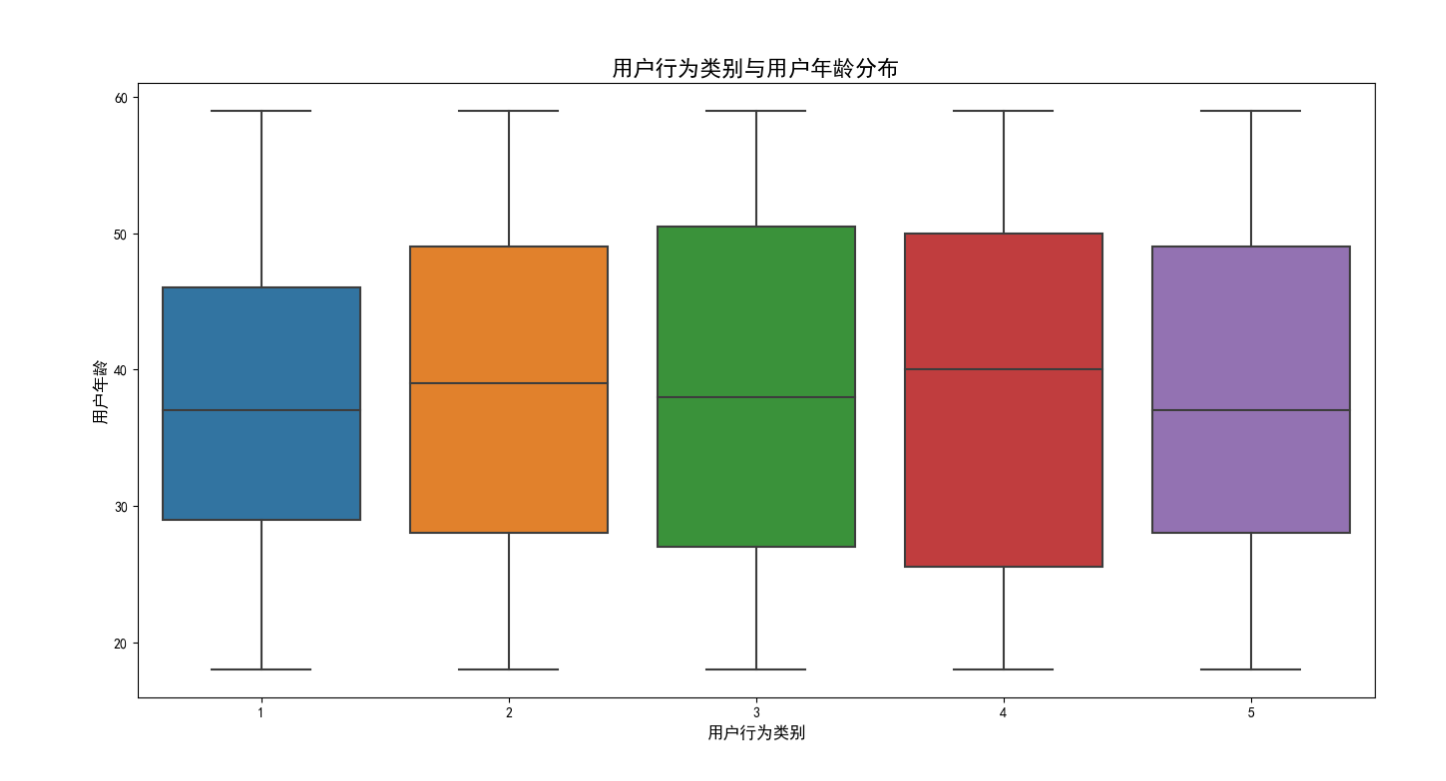
1类和5类的年龄中位数比其他类低,4类的年龄中位数最高,但年龄与用户行为类别没有显著关系。
4.10 用户行为与性别
gender_sales = data.groupby(['User Behavior Class', 'Gender']).size().unstack(fill_value=0)fig, ax = plt.subplots(figsize=(16, 8))
gender_sales.plot(kind='bar', stacked=True, ax=ax)
for i, (behavior_idx, model_row) in enumerate(gender_sales.iterrows()):cum_height = 0for model_idx, value in model_row.items():percentage = value / model_row.sum() * 100if value > 0:ax.text(i, cum_height + value/2, f'{model_idx}: {percentage:.1f}%', ha='center', va='center', color='black', fontsize=12, fontweight='bold')cum_height += valueax.legend().set_visible(False)
ax.set_title('用户行为类别与用户性别分布', fontsize=16)
ax.set_xlabel('用户行为类别', fontsize=12)
ax.set_ylabel('用户数量', fontsize=12)
ax.set_xticklabels(gender_sales.index, rotation=0)
plt.tight_layout()
plt.show()
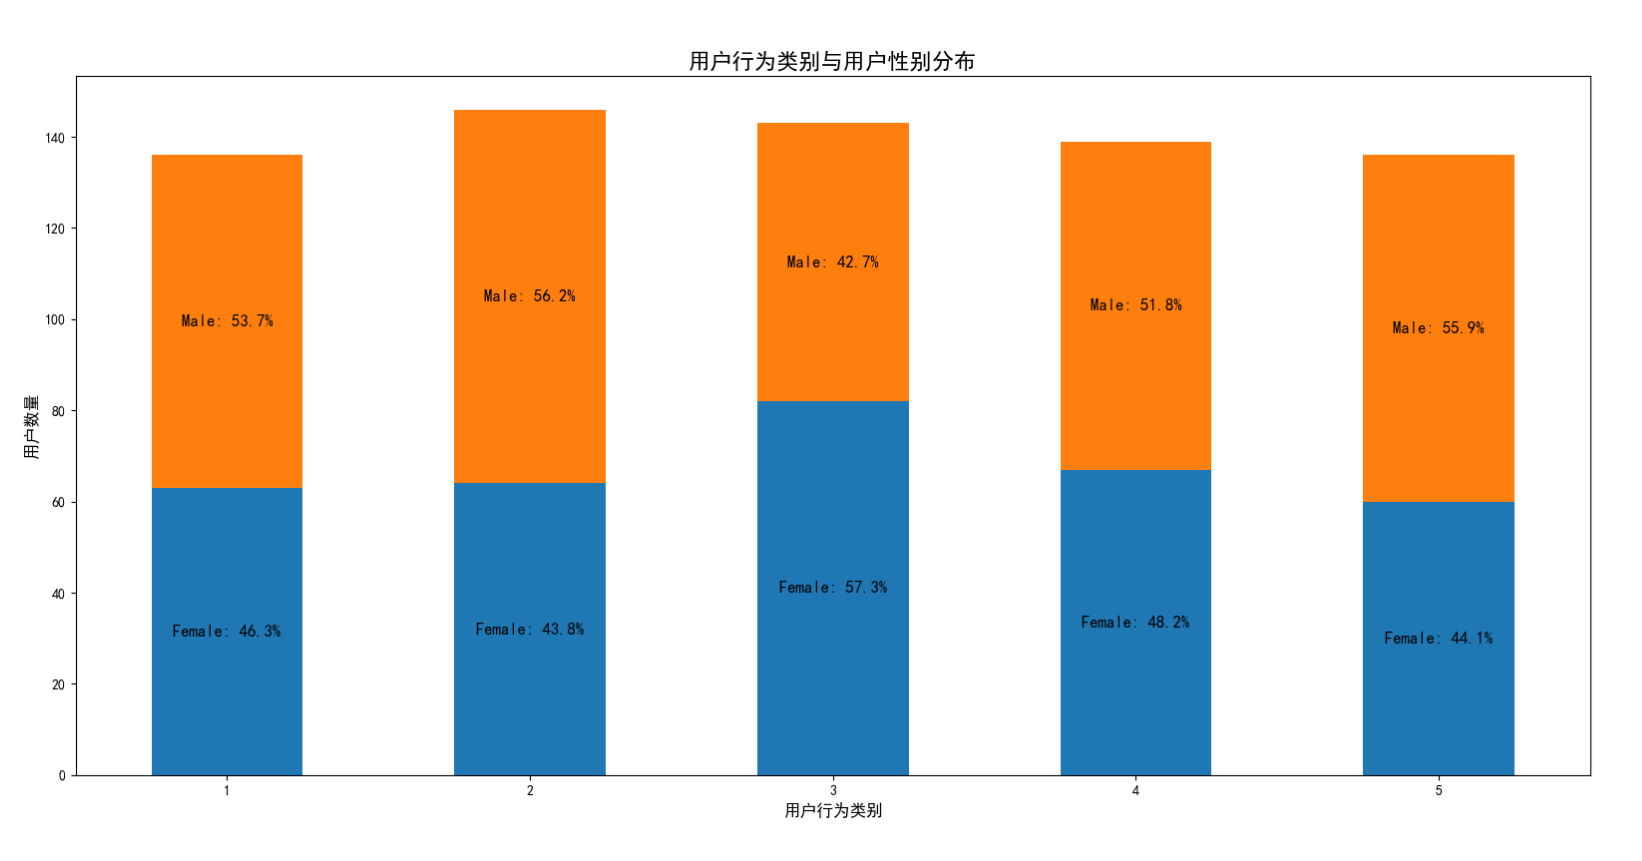
不同用户行为类别的性别分布显示,3类女性占比最大,2类和4类女性占比比其他类小,但性别与用户行为类别没有显著关系。
五、总结
通过以上可视化分析,我们可以清晰地看到不同用户行为类别的特征分布。这些分析结果不仅有助于理解用户的使用习惯,还可以为手机制造商优化产品设计、运营商制定更智能的流量套餐方案提供数据支持,并为后续用户行为分类提供依据。


