数据来源
https://challenge.isic-archive.com/data/#2019
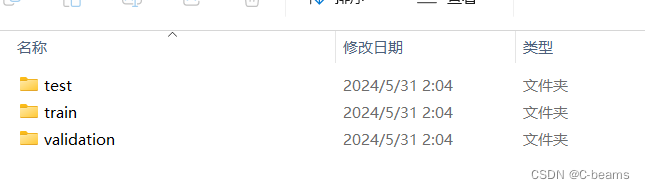
数据划分
写了个脚本划分
for line in open('ISIC/labels.csv').readlines()[1:]:split_line = line.split(',')img_file = split_line[0]benign_malign = split_line[1]# 0.8 for train, 0.1 for test, 0.1 for validationrandom_num = random.random()if random_num < 0.8:location = traintrain_examples += 1elif random_num < 0.9:location = validationvalidation_examples += 1else:location = testtest_examples += 1if int(float(benign_malign)) == 0:shutil.copy('ISIC/images/' + img_file + '.jpg',location + 'benign/' + img_file + '.jpg')elif int(float(benign_malign)) == 1:shutil.copy('ISIC/images/' + img_file + '.jpg',location + 'malignant/' + img_file + '.jpg')print(f'Number of training examples {train_examples}')
print(f'Number of test examples {test_examples}')
print(f'Number of validation examples {validation_examples}')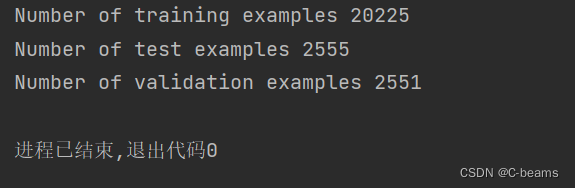
数据生成模块
train_datagen = ImageDataGenerator(rescale=1.0 / 255,rotation_range=15,zoom_range=(0.95, 0.95),horizontal_flip=True,vertical_flip=True,data_format='channels_last',dtype=tf.float32,
)train_gen = train_datagen.flow_from_directory('data/train/',target_size=(img_height, img_width),batch_size=batch_size,color_mode='rgb',class_mode='binary',shuffle=True,seed=123,
)
模型加载和运行
由于数据量较大,本次使用NasNet, 来源于nasnet | Kaggle
# NasNet
model = keras.Sequential([hub.KerasLayer(r'C:\\Users\\32573\\Desktop\\tools\py\\cancer_classification_project\\saved_model',trainable=True),layers.Dense(1, activation='sigmoid'),
])
model.compile(optimizer=keras.optimizers.Adam(3e-4),loss=[keras.losses.BinaryCrossentropy(from_logits=False)],metrics=['accuracy']
)model.fit(train_gen,epochs=1,steps_per_epoch=train_examples // batch_size,validation_data=validation_gen,validation_steps=validation_examples // batch_size,
)运行结果

模型其他评估指标
METRICS = [keras.metrics.BinaryAccuracy(name='accuracy'),keras.metrics.Precision(name='precision'),keras.metrics.Recall(name='Recall'),keras.metrics.AUC(name='AUC'),
]
绘制roc图
def plot_roc(label, data):predictions = model.predict(data)fp, tp, _ = roc_curve(label, predictions)plt.plot(100*fp, 100*tp)plt.xlabel('False Positives [%]')plt.ylabel('True Positives [%]')plt.show()test_labels = np.array([])
num_batches = 0for _, y in test_gen:test_labels = np.append(test_labels, y)num_batches = 1if num_batches == math.ceil(test_examples / batch_size):breakplot_roc(test_labels, test_gen)


全生态接入系统技术白皮书)


