文章目录
- 项目介绍
- 特征工程
- 1、导入数据分析工具包
- 2、数据加载
- 3、最大值最小值归一化
- 4、数据正态化操作(Box-Cox变换)
- 5、定义数据获取方法
- 6、异常值过滤
- 6.1、岭回归算法检测异常值
- 6.2、套索回归算法检测异常值
- 6.3、支持向量机SVR算法检测异常值
- 6.4、Xgboost算法检测异常值
- 6.5、过滤异常值
- 7、多重共线性
- 7.1、多重共线性
- 7.2、对模型影响
- 7.3、检验方法
- 7.4、原理(了解)
- 7.5、查看方差膨胀因子
- 7.6、PCA降维
- 8、模型初验
- 8.1、导入相关算法
- 8.2、数据拆分
- 8.3、多远线性回归模型
- 8.4、训练数据验证数据评估可视化
- 8.5、K近邻算法
- 8.6、决策树回归
- 8.7、随机森林
- 8.8、SVR支持向量机
- 8.9、lightGBM
- 8.10、GBDT
- 8.11、结论
个人主页:道友老李
欢迎加入社区:道友老李的学习社区
【机器学习】实战:天池工业蒸汽量项目(一)数据探索
项目介绍
在工业环境中,蒸汽是一种非常常见的能源形式,被广泛应用于各种加热过程、发电以及其它工艺过程中。准确地预测蒸汽的需求量可以帮助企业优化其生产计划,提高能效,减少能源浪费,并降低运营成本。
通常,这样的项目会包含以下几个方面:
- 数据收集:从工业现场的传感器和其他数据源收集历史数据,包括但不限于温度、压力、流量等与蒸汽生成和消耗相关的参数。
- 数据分析:对收集到的数据进行清洗、预处理,并通过统计分析或可视化工具来理解数据的特性。
- 模型建立:使用机器学习算法或者深度学习技术构建预测模型,这些模型能够基于输入的历史数据预测未来的蒸汽需求量。常用的模型可能包括线性回归、随机森林、支持向量机(SVM)、神经网络等。
- 模型评估:通过交叉验证或其他评估方法测试模型的性能,确保模型具有良好的泛化能力,能够在未见过的数据上做出准确的预测。
- 解决方案部署:将训练好的模型部署到实际的工业环境中,实时接收新数据并输出预测结果,帮助工厂实现更高效的能源管理。
- 持续优化:根据模型在真实环境中的表现不断调整和优化,以适应变化的工作条件和技术进步。
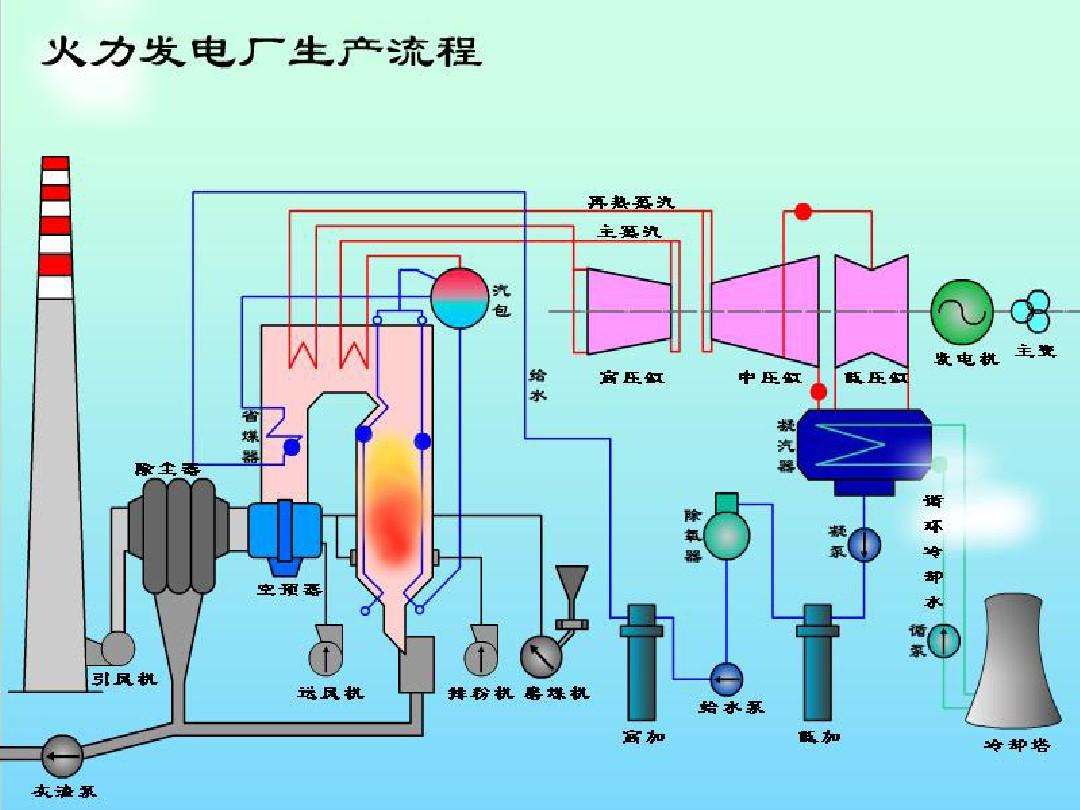
火力发电的基本原理是:燃料在燃烧时加热水生成蒸汽,蒸汽压力推动汽轮机旋转,然后汽轮机带动发电机旋转,产生电能。在这一系列的能量转化中,影响发电效率的核心是锅炉的燃烧效率,即燃料燃烧加热水产生高温高压蒸汽。锅炉的燃烧效率的影响因素很多,包括锅炉的可调参数,如燃烧给量,一二次风,引风,返料风,给水水量;以及锅炉的工况,比如锅炉床温、床压,炉膛温度、压力,过热器的温度等。

经脱敏后的锅炉传感器采集的数据(采集频率是分钟级别),根据锅炉的工况,预测产生的蒸汽量。
特征工程
1、导入数据分析工具包
import numpy as np
import pandas as pd
import matplotlib.pyplot as plt
import seaborn as sns
from scipy import stats
from sklearn import preprocessing
import warnings
warnings.filterwarnings("ignore")
2、数据加载
加载数据探索处理之后的数据。
all_data = pd.read_csv('./processed_zhengqi_data.csv')
display(all_data.head())
cond = all_data['label'] == 'train'
train_data = all_data[cond]
train_data.drop(labels = 'label',axis = 1,inplace=True)
train_data.head()
3、最大值最小值归一化
归一化之前数据查看
# 特征归一化
columns=list(all_data.columns)
# 删除标签列索引
columns.remove('label')
# 删除目标值
columns.remove('target')
all_data[columns].describe()
最大值最小值归一化
# 定义归一化方法
def norm_min_max(col):return (col-col.min())/(col.max()-col.min())
all_data_normed = all_data[columns].apply(norm_min_max,axis=0)
all_data_normed.describe()
sklearn自带方法最大值最小值归一化
# 导包
from sklearn import preprocessing
min_max_scaler = preprocessing.MinMaxScaler()
# 处理完后,数据变换为Numpy数组
all_data_normed = min_max_scaler.fit_transform(all_data[columns])
all_data_normed = pd.DataFrame(all_data_normed,columns=columns)
all_data_normed.describe()
处理结果一致~
4、数据正态化操作(Box-Cox变换)
查看特征变量‘V0’的数据分布直方图、并绘制Q-Q图查看数据是否近似于正态分布、特征目标值相关性
获取训练数据
cond = all_data['label'] == 'train'
train_data = all_data[cond]
train_data.drop(labels='label',axis = 1,inplace=True)
可视化
plt.figure(figsize=(12,4))
# 绘制直方图
ax = plt.subplot(1,3,1)
# 拟合标准正态分布
sns.distplot(train_data['V0'],fit=stats.norm)# 绘制Q-Q图
ax = plt.subplot(1,3,2)
# 生成样本数据相对于指定理论分布(默认为正态分布)的分位数的概率图
stats.probplot(train_data['V0'],plot = ax)
plt.title('skew='+'{:.4f}'.format(stats.skew(train_data['V0'])))# 绘制特征和目标值相关性散点图
ax = plt.subplot(1,3,3)
plt.scatter(train_data['V0'], train_data['target'],s = 5,alpha=0.5)
plt.title('corr='+'{:.2f}'.format(np.corrcoef(train_data['V0'],train_data['target'])[0][1]))

skew函数计算数据集的偏度:
- skew = 0,正态分布
- skew > 0,向右偏移
- skew < 0,向左偏移
查看所有特征直方图、Q-Q图、特征目标值散点图
fcols = 3
columns = list(train_data.columns)
columns.remove('target')
frows = len(columns)
plt.figure(figsize=(4*fcols,4*frows))
i=0
for col in columns:feature = train_data[[col, 'target']].dropna()i+=1plt.subplot(frows,fcols,i)sns.distplot(feature[col] , fit=stats.norm);plt.title(col)plt.xlabel('')i+=1plt.subplot(frows,fcols,i)_=stats.probplot(feature[col], plot=plt)plt.title('skew='+'{:.4f}'.format(stats.skew(feature[col])))plt.xlabel('')plt.ylabel('')i+=1plt.subplot(frows,fcols,i)plt.plot(feature[col], feature['target'],'.',alpha=0.5)plt.title('corr='+'{:.2f}'.format(np.corrcoef(feature[col], feature['target'])[0][1]))

对特征,进行Box-Cox变换,Box-Cox变换可以明显地改善数据的正态性、对称性和方差相等性,对许多实际数据都是行之有效!
# 绘图显示Box-Cox变换对数据分布影响
fcols = 6
columns = list(train_data.columns)
columns.remove('target')
frows = len(columns)
plt.figure(figsize=(4*fcols,4*frows))
i=0
def norm_min_max(feature):return (feature-feature.min())/(feature.max()-feature.min())for col in columns:feature = train_data[[col, 'target']].dropna()i+=1plt.subplot(frows,fcols,i)sns.distplot(feature[col] , fit=stats.norm);plt.title(col+' raw')plt.xlabel('')i+=1plt.subplot(frows,fcols,i)_=stats.probplot(feature[col], plot=plt)plt.title('skew='+'{:.4f}'.format(stats.skew(feature[col])))plt.xlabel('')plt.ylabel('')i+=1plt.subplot(frows,fcols,i)plt.plot(feature[col], feature['target'],'.',alpha=0.5)plt.title('corr='+'{:.2f}'.format(np.corrcoef(feature[col], feature['target'])[0][1]))# Box-Cox转变,视图可视化i+=1plt.subplot(frows,fcols,i)trans_feature, lambda_feature = stats.boxcox(feature[col].dropna()+1)trans_feature = norm_min_max(trans_feature)  sns.distplot(trans_feature , fit=stats.norm);plt.title(col+' Tramsformed')plt.xlabel('')i+=1plt.subplot(frows,fcols,i)_=stats.probplot(trans_feature, plot=plt)plt.title('skew='+'{:.4f}'.format(stats.skew(trans_feature)))plt.xlabel('')plt.ylabel('')i+=1plt.subplot(frows,fcols,i)plt.plot(trans_feature, feature['target'],'.',alpha=0.5)plt.title('corr='+'{:.2f}'.format(np.corrcoef(trans_feature,feature['target'])[0][1]))

从回归结果可见,经过Box-Cox变换数据分布,更加正态化,所以进行Box-Cox变换很有必要 Box-Cox变换是Box和Cox在1964年提出的一种广义幂变换方法,是统计建模中常用的一种数据变换,用于连续的响应变量不满足正态分布的情况 Box-Cox变换的一般形式为:

# 进行Box-Cox变换
columns=list(all_data.columns)
# 删除标签列索引
columns.remove('label')
# 删除目标值
columns.remove('target')
for col in columns:   # transform columnall_data.loc[:,col], _ = stats.boxcox(all_data.loc[:,col]+1)
5、定义数据获取方法
from sklearn.model_selection import train_test_split
def get_train_data():train_data = all_data[all_data["label"]=="train"]# 数据拆分:训练数据和验证数据y = train_data.targetX = train_data.drop(["label","target"],axis=1)return X,y
# 提取训练和验证数据
def split_train_data():train_data = all_data[all_data["label"]=="train"]# 数据拆分:训练数据和验证数据y = train_data.targetX = train_data.drop(["label","target"],axis=1)X_train,X_valid,y_train,y_valid=train_test_split(X,y,test_size=0.2)return X_train,X_valid,y_train,y_valid# 提取预测数据
def get_test_data():# 参数drop = True,表示将原来的行索引,直接删除test_data = all_data[all_data["label"]=="test"].reset_index(drop=True)return test_data.drop(["label","target"],axis=1)
6、异常值过滤
# 基于模型预测的异常值检测
from sklearn.metrics import mean_squared_error
def find_outliers(model, X, y, sigma=3):# 模型训练model.fit(X,y)y_pred = pd.Series(model.predict(X), index=y.index)# 计算预测值和真实值之差resid = y - y_predmean_resid = resid.mean()std_resid = resid.std()# 异常值计算z = (resid - mean_resid)/std_resid # Z-score归一化 outliers = z[abs(z)>sigma].index # 正太分布异常值过滤:3σ法则# 输出模型评价print('R2=',model.score(X,y))print("mse=",mean_squared_error(y,y_pred))print('---------------------------------------')# 残差数据print('mean of residuals:',mean_resid)print('std of residuals:',std_resid)print('---------------------------------------')# 异常值点print(len(outliers),'outliers:')print(outliers.tolist())# 数据可视化# 真实值预测值散点图plt.figure(figsize=(15,5))ax_131 = plt.subplot(1,3,1)plt.plot(y,y_pred,'.')plt.plot(y.loc[outliers],y_pred.loc[outliers],'ro')plt.legend(['Accepted','Outlier'])plt.xlabel('y')plt.ylabel('y_pred');# 真实值和残差散点图ax_132=plt.subplot(1,3,2)plt.plot(y,y-y_pred,'.')plt.plot(y.loc[outliers],y.loc[outliers]-y_pred.loc[outliers],'ro')plt.legend(['Accepted','Outlier'])plt.xlabel('y')plt.ylabel('y - y_pred');# 直方图ax_133=plt.subplot(1,3,3)z.plot.hist(bins=50,ax=ax_133)z.loc[outliers].plot.hist(color='r',bins=50,ax=ax_133)plt.legend(['Accepted','Outlier'])plt.xlabel('z')plt.savefig('outliers.png')return outliers
6.1、岭回归算法检测异常值
# 获取训练数据
from sklearn.linear_model import Ridge
X_train, y_train = get_train_data()# 使用岭回归查找异常值
outliers1 = find_outliers(Ridge(), X_train, y_train)

6.2、套索回归算法检测异常值
# 获取训练数据
from sklearn.linear_model import Lasso
X_train, y_train = get_train_data()# 使用岭回归查找异常值
outliers2 = find_outliers(Lasso(), X_train, y_train)
6.3、支持向量机SVR算法检测异常值
# 获取训练数据
from sklearn.svm import SVR
X_train, y_train = get_train_data()# 使用岭回归查找异常值
outliers3 = find_outliers(SVR(), X_train, y_train)
6.4、Xgboost算法检测异常值
# 获取训练数据
from xgboost import XGBRegressor
X_train, y_train = get_train_data()# 使用岭回归查找异常值
outliers4 = find_outliers(XGBRegressor(), X_train, y_train)
6.5、过滤异常值
outliers12 = np.union1d(outliers1,outliers2)
outliers34 = np.union1d(outliers3,outliers4)
outliers = np.union1d(outliers12,outliers34)
display(outliers)
# 过滤异常值
all_data_drop = all_data.drop(labels=outliers)
all_data_drop.shape
7、多重共线性
7.1、多重共线性
是指各特征之间存在线性相关关系,即一个特征可以是其他一个或几个特征的线性组合。如果存在多重共线性,求损失函数时矩阵会不可逆,导致求出结果会与实际不同,有所偏差。
x1=[1,2,3,4,5]
x2=[2,4,6,8,10]
x3=[2,3,4,5,6]
# x2=x1*2
# x3=x1+1
上述x2,x3都和x1成线性关系,这会进行回归时,影响系数的准确性,说白了就是多个特征存在线性关系,数据冗余,但不完全是,所以要将成线性关系的特征进行降维。
7.2、对模型影响
- 变量之间高度相关时,可能会给回归的结果造成混乱,甚至会把分析引入歧途。
- 参数的含义不明确。
- 变量的显著性检验失去意义,可能将重要的解释变量排除在模型之外 。
- 可使得本来不重要的变量回归系数估计得很大或者重要的变量回归系数估计得很小,从而产生错误的判断
- 模型的预测功能失效。变大的[方差]容易使[区间]预测的区间变大,使预测失去意义。
- 多重共线性影响的是模型的系数确定性、解释性,通俗一点讲,就是线性回归模型的系数没有训练准确。
7.3、检验方法
方差膨胀系数(VIF):
通常情况下,当VIF<10,说明不存在多重共线性;当10<=VIF<100,存在较强的多重共线性,当VIF >= 100,存在严重多重共线性。
# 导入计算膨胀因子的库
from statsmodels.stats.outliers_influence import variance_inflation_factor
7.4、原理(了解)
方差膨胀系数是衡量多元线性回归模型中多重共线性严重程度的一种度量。
它表示回归系数估计量的方差与假设自变量间不线性相关时方差相比的比值。
7.5、查看方差膨胀因子
# 安装相应库 pip install statsmodels
# 多重共线性方差膨胀因子
from statsmodels.stats.outliers_influence import variance_inflation_factor
#多重共线性
X_train,y_train = get_train_data()
X_train = np.matrix(X_train)
VIF_list=[round(variance_inflation_factor(X_train, i),2) for i in range(X_train.shape[1])]
VIF_list
7.6、PCA降维
from sklearn.decomposition import PCA
pca = PCA(n_components = 22,whiten=True)
X_train,y_train = get_train_data()
X_train_pca = np.matrix(pca.fit_transform(X_train))
VIF_pca_list=[round(variance_inflation_factor(X_train_pca, i),2) for i in range(X_train_pca.shape[1])]
print(VIF_pca_list)
可知,经过降维,去除了特征的多重共线性!
对预测数据,也进行降维操作
X_test = get_test_data()
X_test_pca = pca.transform(X_test)
X_test_pca
8、模型初验
8.1、导入相关算法
from sklearn.linear_model import LinearRegression  #线性回归
from sklearn.neighbors import KNeighborsRegressor  #K近邻回归
from sklearn.tree import DecisionTreeRegressor     #决策树回归
from sklearn.ensemble import RandomForestRegressor #随机森林回归
from sklearn.svm import SVR  #支持向量回归
import lightgbm as lgb #lightGbm模型
from sklearn.ensemble import GradientBoostingRegressorfrom sklearn.model_selection import train_test_split # 切分数据
from sklearn.metrics import mean_squared_error #评价指标
8.2、数据拆分
#采用 pca 保留16维特征的数据
train_data = np.load('./train_data_pca.npz')['X_train']
target_data = np.load('./train_data_pca.npz')['y_train']
# 切分数据 训练数据80% 验证数据20%
X_train,X_valid,y_train,y_valid=train_test_split(train_data,target_data,test_size=0.2)
8.3、多远线性回归模型
clf = LinearRegression()
clf.fit(X_train, y_train)
score = mean_squared_error(y_valid, clf.predict(X_valid))
print("LinearRegression:   ", score)
8.4、训练数据验证数据评估可视化
def plot_learning_curve(model, X_train, X_valid, y_train, y_valid):'绘制学习曲线:只需要传入算法(或实例对象)、X_train、X_valid、y_train、y_valid'train_score = []test_score = []for i in range(10, len(X_train)+1, 10):model.fit(X_train[:i], y_train[:i])# 训练数据评估y_train_predict = model.predict(X_train[:i])train_score.append(mean_squared_error(y_train[:i], y_train_predict))# 验证数据评估y_valid_predict = model.predict(X_valid)test_score.append(mean_squared_error(y_valid, y_valid_predict))# 可视化plt.plot([i for i in range(1, len(train_score)+1)],train_score, label="train")plt.plot([i for i in range(1, len(test_score)+1)],test_score, label="test")plt.legend()
多元线性回归模型,不同训练样本,对【训练数据】【验证数据】评估可视化
plot_learning_curve(LinearRegression(), X_train, X_valid, y_train, y_valid)

8.5、K近邻算法
for i in range(3,20):clf = KNeighborsRegressor(n_neighbors=i) # 最近三个clf.fit(X_train, y_train)score = mean_squared_error(y_valid, clf.predict(X_valid))print("KNeighborsRegressor: ", score)
8.6、决策树回归
clf = DecisionTreeRegressor()
clf.fit(X_train, y_train)
score = mean_squared_error(y_valid, clf.predict(X_valid))
print("DecisionTreeRegressor:   ", score)
8.7、随机森林
clf = RandomForestRegressor(n_estimators=200, # 200棵树模型max_depth= 10,max_features = 'auto',# 构建树时,特征筛选量min_samples_leaf=10,# 是叶节点所需的最小样本数min_samples_split=40,# 是分割所需的最小样本数criterion='squared_error')
clf.fit(X_train, y_train)
score = mean_squared_error(y_valid, clf.predict(X_valid))
print("RandomForestRegressor:   ", score)
8.8、SVR支持向量机
'''
C:
表示错误项的惩罚系数C越大,即对分错样本的惩罚程度越大,因此在训练样本中准确率越高,
但是泛化能力降低;相反,减小C的话,容许训练样本中有一些误分类错误样本,泛化能力强。
对于训练样本带有噪声的情况,一般采用后者,把训练样本集中错误分类的样本作为噪声。
gamma:
‘rbf’, ‘poly’ 和‘sigmoid’ 核函数的系数
epsilon:
1. 用来定义模型对于错误分类的容忍度,即错误分类而不受到惩罚
2. epsilon的值越大,模型允许错误分类的容忍度越高,反之,容忍度越小
3. 支持向量的个数对 epsilon的大小敏感,即 epsilon的值越大,支持向量的个数越少,反之,支持向量的个数越多
4. 也可以理解为epsilon的值越小,模型越过拟合,反之,越大越欠拟合'''
clf1 = SVR(kernel='rbf',C = 1,gamma=0.01,tol = 0.0001,epsilon=0.3)
clf1.fit(X_train, y_train)
score = mean_squared_error(y_valid, clf1.predict(X_valid))
print("支持向量机高斯核函数:   ", score)clf2 = SVR(kernel='poly')
clf2.fit(X_train, y_train)
score = mean_squared_error(y_valid, clf2.predict(X_valid))
print("支持向量机多项式核函数:   ", score)
8.9、lightGBM
'''
min_child_samples
一个叶子上的最小数据量。默认设置为20。根据数据量来确定,当数据量比较大时,
应该提升这个数值,让叶子节点的数据分布相对稳定,提高模型的泛华能力。
max_depth:
树模型的最大深度。防止过拟合的最重要的参数,一般限制为3~5之间。
是需要调整的核心参数,对模型性能和泛化能力有决定性作用。
num_leaves:
一棵树上的叶子节点个数。默认设置为31,和max_depth配合来空值树的形状,
一般设置为(0, 2^max_depth - 1]的一个数值。是一个需要重点调节的参数,对模型性能影响很大。
reg_alpha:
L1正则化参数,别名:lambda_l1。默认设置为0。一般经过特征选择后这个参数不会有特别大的差异,
如果发现这个参数数值大,则说明有一些没有太大作用的特征在模型内。需要调节来控制过拟合。
reg_lambda:
L2正则化参数,别名:lambda_l2。默认设置为0。较大的数值会让各个特征对模型的影响力趋于均匀,
不会有单个特征把持整个模型的表现。需要调节来控制过拟合
'''
clf = lgb.LGBMRegressor(learning_rate=0.05, # 学习率n_estimators=300,# 集成树数量min_child_samples=10,# 是叶节点所需的最小样本数max_depth=5, # 决策树深度num_leaves = 25,colsample_bytree =0.8,#构建树时特征选择比例subsample=0.8,# 抽样比例reg_alpha = 0.5,reg_lambda = 0.1 )
clf.fit(X_train, y_train)
score = mean_squared_error(y_valid, clf.predict(X_valid))
print("LGB模型均方误差:   ", score)
8.10、GBDT
%%time
'''参数说明:
例如,如果min_sample_split = 6并且节点中有4个样本,则不会发生拆分(不管熵是多少);
假设min_sample_leaf = 3并且一个含有5个样本的节点可以分别分裂成2个和3个大小的叶子节点,
那么这个分裂就不会发生,因为最小的叶子大小为3
损失函数loss:
'squared_error':均方误差
'absolute_error':绝对损失
'huber':上面两者融合
'''
clf = GradientBoostingRegressor(learning_rate=0.03, # 学习率loss='huber',  # 损失函数max_depth=14, # 决策树深度max_features='sqrt',# 节点分裂时参与判断的最大特征数min_samples_leaf=10,# 是叶节点所需的最小样本数min_samples_split=40,# 是分割所需的最小样本数n_estimators=300,# 集成树数量subsample=0.8)# 抽样比例
clf.fit(X_train, y_train)
score = mean_squared_error(y_valid, clf.predict(X_valid))
print("GradientBoostingRegressor:   ", score)
8.11、结论
- K近邻算法、决策树回归表现比较差
- 多元线性回归有待后续继续验证(存在过拟合情况)


