背景
如果你要为应用程序构建规范或用户故事,那么务必先把应用程序每个组件的监控指标考虑进来,千万不要等到项目结束或部署之前再做这件事情。——《Prometheus监控实战》
去年写了一篇在Docker环境下部署若依微服务ruoyi-cloud项目的文章,当时使用的是 docker-compose 在单台机器上部署若依微服务 ruoyi-cloud 项目;在这个基础上,作为演示项目,我们计划实现对所有基础组件和微服务的监控。之前记录了搭建 Prometheus 与 Grafana 监控系统的过程。今天这篇文章主要是记录下对 InfluxDB 的监测,用到的 exporter 是: Telegraf , Telegraf 是一个开源的、插件驱动的服务器代理,用于收集、处理、和发送各种性能数据。它是 InfluxData 的一部分,常用于与 InfluxDB 结合使用,但也支持输出到其他存储系统,如 Prometheus 、 Graphite 、 OpenTSDB 、 ElasticSearch 等。。
虚机资源
共用到了2台虚机,1台作为应用服务节点,1台运维监控节点。
| 主机名 | IP | 说明 |
|---|---|---|
| svc | 192.168.44.168 | 服务节点 |
| ops | 192.168.44.169 | 监控节点 |
基本选用当前最新版本,即将安装的 Prometheus 和 Grafana 及组件版本信息如下:
- Prometheus版本:v2.54.1
- Grafana版本:11.2.0
- Telegraf版本:1.19.3
系统环境
[root@ops ~]# uname -a
Linux ops 5.10.0-182.0.0.95.oe2203sp3.x86_64 #1 SMP Sat Dec 30 13:10:36 CST 2023 x86_64 x86_64 x86_64 GNU/Linux
[root@ops ~]# cat /proc/version
Linux version 5.10.0-182.0.0.95.oe2203sp3.x86_64 (root@dc-64g.compass-ci) (gcc_old (GCC) 10.3.1, GNU ld (GNU Binutils) 2.37) #1 SMP Sat Dec 30 13:10:36 CST 2023
ops节点:docker-compose安装Prometheus与Grafana
参考云原生之运维监控实践-OpenEuler22.03SP3上安装Prometheus与Grafana实现主机状态监测
svc节点:docker-compose安装Telegraf
有了 Prometheus 与 Grafana 的基础环境,我们来实现对 InfluxDB 状态的监控:通过 Telegraf 快速采集 InfluxDB 运行数据并以 Prometheus 格式提供,供 Prometheus 进行采集和分析。
Telegraf 是一个高效且灵活的指标收集代理,它支持从多种来源收集数据并将其转发到多个输出目标。无论是服务器监控、应用性能监控,还是云服务、容器和网络设备的监控, Telegraf 都能够满足需求,并且具有极低的性能开销。通过其插件架构, Telegraf 提供了很高的可扩展性和灵活性,非常适合用于现代的监控和 Observability 系统中。
安装Telegraf
在需要监测的主机上,编辑 docker-compose.yml 文件,增加安装 Telegraf 配置。
- [root@svc monitoring]# vi docker-compose.yml
version: '3'
services:ops-telegraf:image: telegraf:1.19.3container_name: ops-telegrafrestart: unless-stoppedports:- "9273:9273"volumes:- "./telegraf/conf/telegraf.conf:/etc/telegraf/telegraf.conf"
- telegraf.conf
通过http://192.168.44.168:8086/debug/vars获取InfluxDB的基础信息,并配置了用户认证信息。此外,还添加了关于CPU、内存、磁盘、IO等系统参数抓取配置。
[[outputs.prometheus_client]]listen = ":9273"[[inputs.influxdb]]urls = ["http://192.168.44.168:8086/debug/vars"]username = "admin"password = "you-guess"[[inputs.cpu]]## Whether to report per-cpu stats or notpercpu = true## Whether to report total system cpu stats or nottotalcpu = true## If true, collect raw CPU time metrics.collect_cpu_time = false# Read metrics about disk usage by mount point
[[inputs.disk]]## By default, telegraf gather stats for all mountpoints.## Setting mountpoints will restrict the stats to the specified mountpoints.# mount_points = ["/"]## Ignore some mountpoints by filesystem type. For example (dev)tmpfs (usually## present on /run, /var/run, /dev/shm or /dev).ignore_fs = ["tmpfs", "devtmpfs"]# Read metrics about disk IO by device
[[inputs.diskio]]## By default, telegraf will gather stats for all devices including## disk partitions.## Setting devices will restrict the stats to the specified devices.# devices = ["sda", "sdb"]## Uncomment the following line if you need disk serial numbers.# skip_serial_number = false[[inputs.mem]][[inputs.swap]][[inputs.processes]][[inputs.kernel]][[inputs.system]]
通过命令: docker-compose up -d 完成镜像拉取、并启动 ops-telegraf 服务。
修改Prometheus配置
在 Prometheus 配置中增加对svc主机上 InfluxDB 运行状态的抓取配置。
- [root@ops monitoring]# vi ./prometheus/conf/prometheus.yml
scrape_configs:- job_name: 'ops-telegraf'scrape_interval: 15sstatic_configs:- targets:- 192.168.44.168:9273
重启 Prometheus 容器。
[root@ops monitoring]# docker restart ops-prometheus
验证telegraf安装结果
- 浏览器验证metrics端点
浏览器访问http://192.168.44.168:9273/metrics
- Prometheus控制台验证influx相关的指标

配置Grafana对主机状态的可视化
浏览器访问http://192.168.44.169:3000。
- 配置数据源
- 点击左侧菜单中的"Add new connection"。
- 选择或搜索"Data Sources"。
- 点击"Add data source"并选择"Prometheus"。
- 在"HTTP"部分输入Prometheus地址,eg:http://192.168.44.169:9090
- 点击"Save & Test"确认连接成功。
- 查看现成的仪表板
https://grafana.com/grafana/dashboards/这个页面是 Grafana 的官方仪表板目录,用户可以在这里找到和共享各种现成的 Grafana 仪表板。这些仪表板覆盖了多种监控需求,包括系统性能、应用监控、网络流量等。用户可以根据自己的需求搜索和导入适合的仪表板,提高监控效率和可视化效果。这里我们搜索 Influx ,结果中有个 InfluxDB ,点击进去可以查看详细的UI效果,复制仪表板的id,此处是11334。
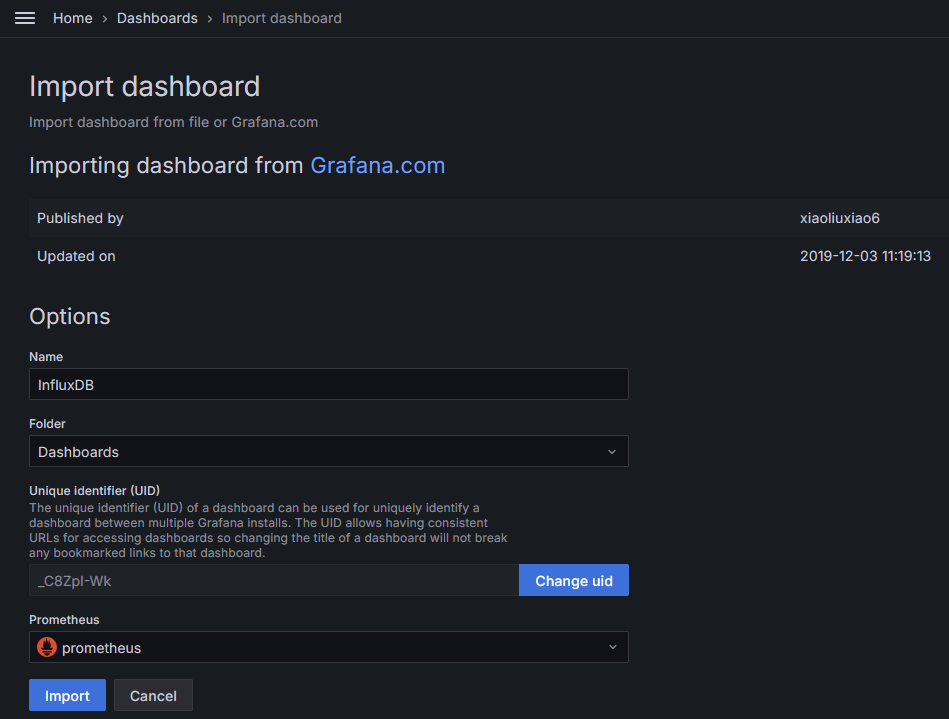
- 导入现成的仪表板
- 在右侧菜单中点击"New"按钮,然后选择"Import"。
- 在输入框中,可以直接输入现成仪表板的ID,或者上传JSON文件。常用的主机监控仪表板ID是11334(InfluxDB)。
- 点击"Load",随后选择已配置好的数据源。
- 点击"Import"完成导入。
InfluxDB监控效果

小总结
If you can’t measure it, you can’t improve it!
没有度量就没有改进,实际上,监控系统有以下两个客户:技术,业务。上述内容即是对技术组件的监控,方便技术方面的改进与优化。
本文记录了在 Docker 环境下通过 Prometheus 和 Grafana 实现对 InfluxDB 服务的监控。具体步骤包括在服务节点上使用 docker-compose 安装 telegraf ,配置 Prometheus 抓取 InfluxDB 的监控数据,并在 Grafana 中配置数据源和导入现成的监控仪表板,以实现对时序数据库服务的性能监控和可视化。
Reference
- 使用docker-compose部署时序数据库InfluxDB1.8.4
- https://grafana.com/grafana/dashboards/
If you have any questions or any bugs are found, please feel free to contact me.
Your comments and suggestions are welcome!


