[matlab]南海地形眩晕图代码
请ChatGPT帮写个南海地形眩晕图代码
图片
图片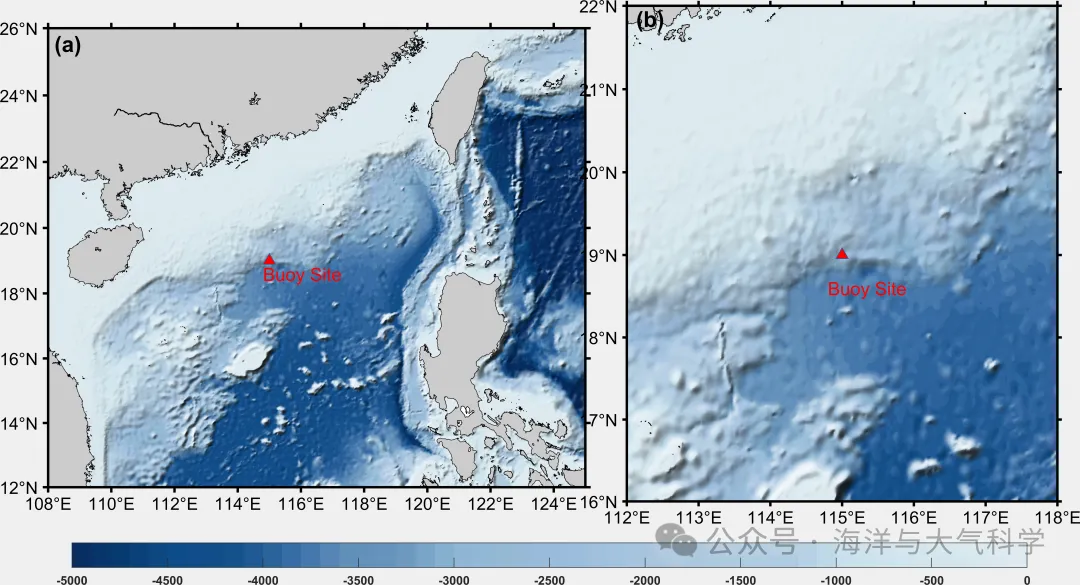
代码
.rtcContent { padding: 30px; } .lineNode {font-size: 12pt; font-family: "Times New Roman", Menlo, Monaco, Consolas, "Courier New", monospace; font-style: normal; font-weight: normal; }
clc;clear;close all
% 读取数据
file='F:\data\etopo\etopo1.nc';
lon=double(ncread(file,'x'));
lat=double(ncread( file,'y'));
h=double(ncread(file,'z'));
% 选定区域南海
area  =[108 125 12 26];
ln =find(lon>=area(1)&lon<=area(2));
la=find(lat>=area(3)&lat<=area(4));
lon = lon(ln);lat  = lat(la);H = h(ln,la);
%% %%m_pcolor画出了区域的等深线图
close all
figure;
set(0,'defaultfigurecolor','w')
set(gcf,'position',[50 50 1300 900])
subplot(121,'position',[0.1 0.065 0.45 0.7])
m_proj('Miller', 'long', [108 125], 'lat', [12 26]);
cmap=flip(colormore_65([50]));
caxis([-5000 0])% 这些必须放在m_shaderelief的前面,不然不可用
% 通过经纬度坐标的高程数据,生成X/Y坐标的高程数据
[IM,X,Y]=m_image(lon,lat,H');
% 将X/Y坐标的高程数据画图,注意设置coords参数为map
m_shadedrelief(X,Y,IM,cmap,'coords','map');
m_gshhs_f('patch',[0.8 0.8 0.8]);
xticks = 108:2:126;
yticks = 12:2:26;
m_grid('tickdir', 'out', 'gridlines', 'no', 'fontsize', 14, 'linewidth', 2, ...'xtick', xticks, 'ytick', yticks);
ax = gca;
ax.LineWidth = 2;
hold on
m_scatter(115,19,'^','sizedata',80,'markerfacecolor','r')
m_text(115-0.2,19-0.4,  'Buoy Site','color','r','fontsize',15);
m_text(108.2,25.55,'(a)', 'FontSize', 18,'Fontweight','bold');
%5 little picture
subplot(122,'position',[0.54 0.12 0.45 0.6])
clc;clear;
% 读取数据
file='F:\data\etopo\etopo1.nc';
lon=double(ncread(file,'x'));
lat=double(ncread( file,'y'));
h=double(ncread(file,'z'));
% 选定区域南海
area  =[112 1118 16 23];
ln =find(lon>=area(1)&lon<=area(2));
la=find(lat>=area(3)&lat<=area(4));
lon = lon(ln);lat  = lat(la);H = h(ln,la);
% 坐标的meshgrid
[x,y]=meshgrid(lon,lat);
x=x'; y=y';
%% %%m_pcolor画出了区域的等深线图
m_proj('Miller', 'long', [112 118], 'lat', [ 16 22]);
cmap=flip(colormore_65([50]));
caxis([-5000 0])% 这些必须放在m_shaderelief的前面,不然不可用
% 通过经纬度坐标的高程数据,生成X/Y坐标的高程数据
[IM,X,Y]=m_image(lon,lat,H');
% 将X/Y坐标的高程数据画图,注意设置coords参数为map
m_shadedrelief(X,Y,IM,cmap,'coords','map');
m_gshhs_f('patch',[0.8 0.8 0.8]);
xticks = 108:1:126;
yticks = 12:1:26;
m_grid('tickdir', 'out', 'gridlines', 'no', 'fontsize', 14, 'linewidth', 2, ...'xtick', xticks, 'ytick', yticks);
ax = gca;
ax.LineWidth = 2;
hold on
m_scatter(115,19,'^','sizedata',80,'markerfacecolor','r')
m_text(115-0.2,19-0.4,  'Buoy Site','color','r','fontsize',15);
m_text(112.13,21.85,'(b)', 'FontSize', 18,'Fontweight','bold');
set(gca, 'DataAspectRatio', [1 0.9 1]); % 设置坐标轴的长宽比
% 添加一个全局 colorbar
hcb = colorbar('southoutside'); % 将 colorbar 放在下面
set(hcb, 'Position', [0.12 0.04 0.8 0.03],'fontsize',10,'fontweight','bold'); % 手动调整 colorbar 位置
export_fig('scs_shadinginterp.jpg','-r700')


